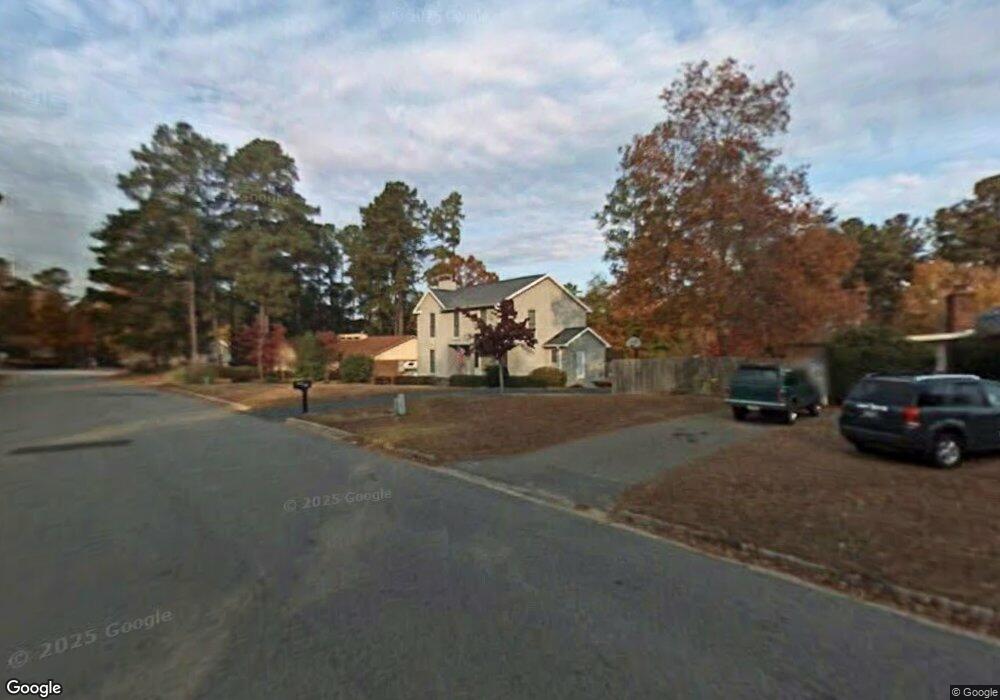
232 Hillbrook Dr Augusta, GA 30907
Estimated Value: $246,639 - $277,000
3
Beds
2
Baths
1,926
Sq Ft
$135/Sq Ft
Est. Value
About This Home
This home is located at 232 Hillbrook Dr, Augusta, GA 30907 and is currently estimated at $259,160, approximately $134 per square foot. 232 Hillbrook Dr is a home located in Columbia County with nearby schools including Westmont Elementary School, Evans Middle School, and Evans High School.
Ownership History
Date
Name
Owned For
Owner Type
Purchase Details
Closed on
Mar 12, 2023
Sold by
Yandell Rebecca N
Bought by
Yandell Rebecca Nelson and Joiner Holly
Current Estimated Value
Home Financials for this Owner
Home Financials are based on the most recent Mortgage that was taken out on this home.
Original Mortgage
$176,000
Outstanding Balance
$170,265
Interest Rate
6.12%
Mortgage Type
New Conventional
Estimated Equity
$88,895
Purchase Details
Closed on
Jul 1, 2005
Sold by
Ezell Andrew J
Bought by
Nelson Rebecca E
Purchase Details
Closed on
Feb 21, 2003
Sold by
Ezell Jo Ann B
Bought by
Ezell Andrew J and Ezell Andrew
Home Financials for this Owner
Home Financials are based on the most recent Mortgage that was taken out on this home.
Original Mortgage
$92,800
Interest Rate
5.29%
Create a Home Valuation Report for This Property
The Home Valuation Report is an in-depth analysis detailing your home's value as well as a comparison with similar homes in the area
Home Values in the Area
Average Home Value in this Area
Purchase History
| Date | Buyer | Sale Price | Title Company |
|---|---|---|---|
| Yandell Rebecca Nelson | -- | -- | |
| Nelson Rebecca E | $135,000 | -- | |
| Ezell Andrew J | -- | -- |
Source: Public Records
Mortgage History
| Date | Status | Borrower | Loan Amount |
|---|---|---|---|
| Open | Yandell Rebecca Nelson | $176,000 | |
| Previous Owner | Ezell Andrew J | $92,800 |
Source: Public Records
Tax History
| Year | Tax Paid | Tax Assessment Tax Assessment Total Assessment is a certain percentage of the fair market value that is determined by local assessors to be the total taxable value of land and additions on the property. | Land | Improvement |
|---|---|---|---|---|
| 2025 | $739 | $91,260 | $18,804 | $72,456 |
| 2024 | $717 | $85,325 | $18,604 | $66,721 |
| 2023 | $717 | $80,214 | $18,604 | $61,610 |
| 2022 | $664 | $71,967 | $14,304 | $57,663 |
| 2021 | $673 | $69,456 | $14,404 | $55,052 |
| 2020 | $642 | $63,409 | $12,804 | $50,605 |
| 2019 | $683 | $67,793 | $12,604 | $55,189 |
| 2018 | $1,685 | $58,389 | $11,504 | $46,885 |
| 2017 | $1,771 | $61,262 | $11,504 | $49,758 |
| 2016 | $1,526 | $54,420 | $11,480 | $42,940 |
| 2015 | $1,463 | $51,973 | $11,380 | $40,593 |
| 2014 | $1,389 | $48,642 | $9,980 | $38,662 |
Source: Public Records
Map
Nearby Homes
- 245 Hillbrook Dr
- 4430 Forrest Dr
- 4418 Columbia Rd
- 4127 Meriden Dr
- 4121 Englewood Dr
- 511 Merrymont Dr
- 4341 Columbia Rd
- 121 Thomas Dr
- 654 Clinton Way W
- 4469 Misty Cove Ct
- 4425 Branchwood Dr
- 211 Kestwick Dr W
- 4524 Oakley Pirkle Rd
- 213 S Belair Rd
- 114 W Lynne Dr
- 155 Stone Mill Dr
- 2110 Oak Ridge Rd
- 186 Kestwick Dr W
- 133 Highview Dr
- 4225 Spruce Ln
Your Personal Tour Guide
Ask me questions while you tour the home.