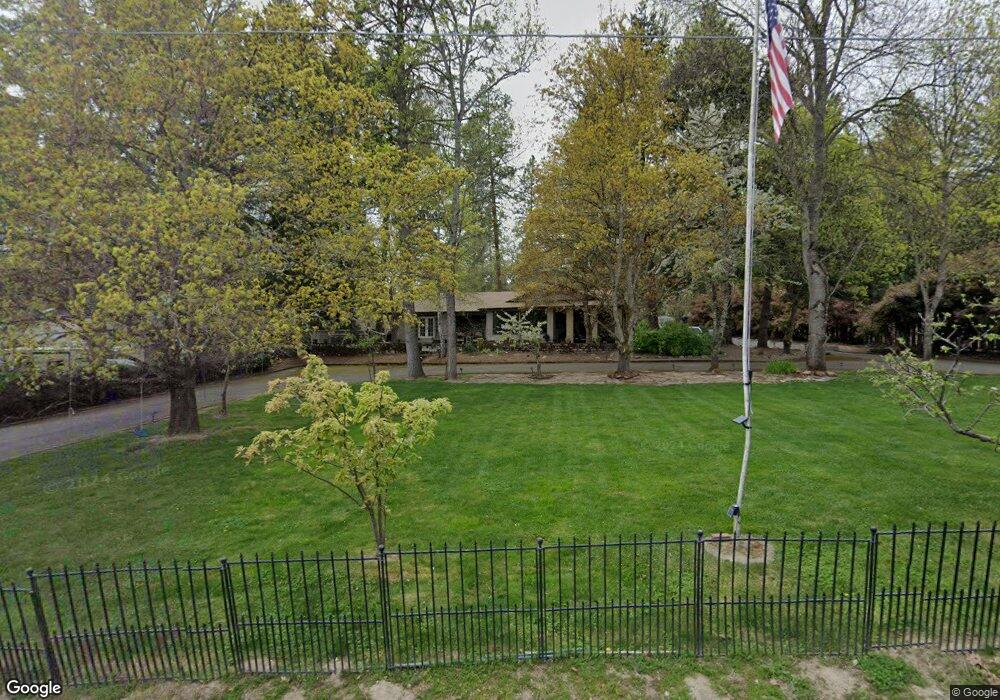
232 Larkin Rd Grants Pass, OR 97527
Estimated Value: $525,924 - $585,000
3
Beds
2
Baths
2,755
Sq Ft
$202/Sq Ft
Est. Value
About This Home
This home is located at 232 Larkin Rd, Grants Pass, OR 97527 and is currently estimated at $555,462, approximately $201 per square foot. 232 Larkin Rd is a home located in Josephine County with nearby schools including Allen Dale Elementary School, South Middle School, and Grants Pass High School.
Ownership History
Date
Name
Owned For
Owner Type
Purchase Details
Closed on
Jul 23, 2021
Sold by
Gates Donald and Gates Catherine
Bought by
Chandler Joe G and Chandler Kelli R
Current Estimated Value
Purchase Details
Closed on
Aug 7, 2020
Sold by
Chandler Joe G and Chandler Kelli R
Bought by
Chandler Joe G and Chandler Kelli R
Home Financials for this Owner
Home Financials are based on the most recent Mortgage that was taken out on this home.
Original Mortgage
$200,000
Interest Rate
3%
Mortgage Type
New Conventional
Create a Home Valuation Report for This Property
The Home Valuation Report is an in-depth analysis detailing your home's value as well as a comparison with similar homes in the area
Purchase History
| Date | Buyer | Sale Price | Title Company |
|---|---|---|---|
| Chandler Joe G | $120,000 | First American | |
| Chandler Joe G | -- | First American |
Source: Public Records
Mortgage History
| Date | Status | Borrower | Loan Amount |
|---|---|---|---|
| Previous Owner | Chandler Joe G | $200,000 |
Source: Public Records
Tax History
| Year | Tax Paid | Tax Assessment Tax Assessment Total Assessment is a certain percentage of the fair market value that is determined by local assessors to be the total taxable value of land and additions on the property. | Land | Improvement |
|---|---|---|---|---|
| 2025 | $3,002 | $375,570 | -- | -- |
| 2024 | $3,002 | $364,640 | -- | -- |
| 2023 | $2,490 | $354,020 | $0 | $0 |
| 2022 | $2,512 | $343,710 | -- | -- |
| 2021 | $2,356 | $333,700 | $0 | $0 |
| 2020 | $2,290 | $323,990 | $0 | $0 |
| 2019 | $2,226 | $314,560 | $0 | $0 |
| 2018 | $2,229 | $305,400 | $0 | $0 |
| 2017 | $2,210 | $296,510 | $0 | $0 |
| 2016 | $1,879 | $287,880 | $0 | $0 |
Source: Public Records
Map
Nearby Homes
- 294 Valle Vista Dr
- 142 Whispering Dr
- 3351 SW Bennett Ln
- 1885 Lonnon Rd
- 2719 SW Garden Meadow Dr
- 3400 Neamar Dr
- 2732 Denton Trail
- 2724 Denton Trail
- 199 Black Oak St
- 209 Twisted Pines Dr
- Lot 4 Sylvan Dr
- 421 Bayard Dr
- Lot 5 Sylvan Dr
- 212 Wagon Wheel Dr
- 2970 Elk Ln
- 0 Sylvan Dr Unit Lot 10 220196204
- 214 SE Sapphire Ct
- 3 Sylvan Dr Unit Lot 3
- 449 S Espey Rd
- 0 Bushnell Way Unit 412
- 220 Larkin Rd
- 250 Larkin Rd
- 237 Larkin Rd
- 235 Larkin Rd
- 200 Larkin Rd
- 221 Larkin Rd
- 321 Larkin Rd
- 0000 View Top Dr
- 385 Larkin Rd
- 0 Larkin Rd
- 3260 New Hope Rd
- 3300 New Hope Rd
- 1562 Lonnon Rd
- 1580 Lonnon Rd
- 3328 New Hope Rd
- 311 Larkin Rd
- 101 Mardan Dr
- 241 E View Place
- 241 View Top Dr Unit 9
- 241 View Top Dr
Your Personal Tour Guide
Ask me questions while you tour the home.