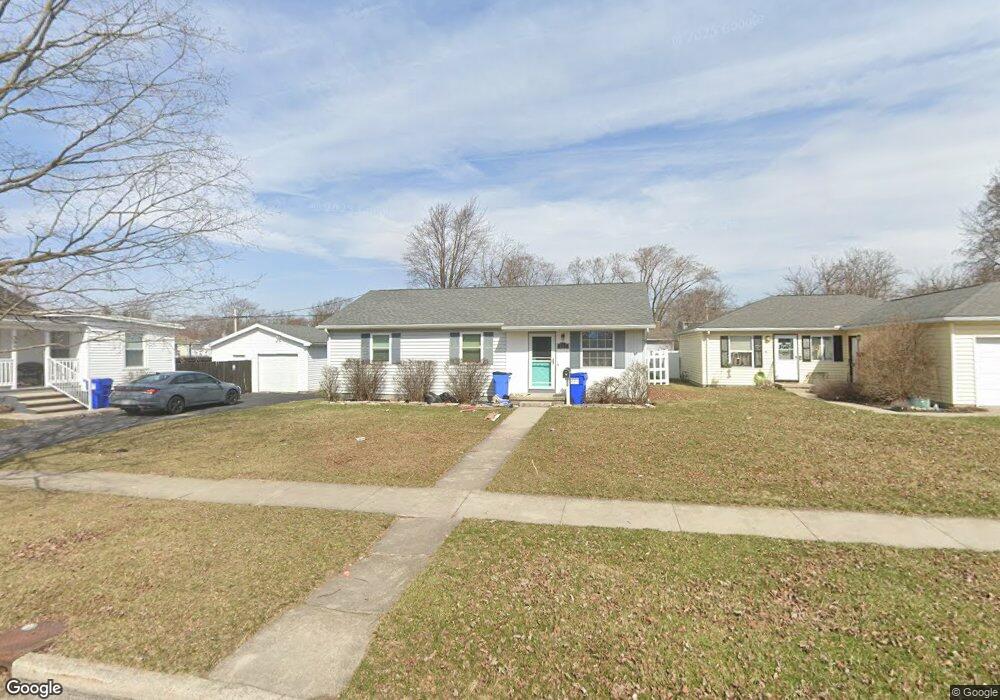
232 Lester Ave Findlay, OH 45840
Estimated Value: $160,000 - $191,237
3
Beds
1
Bath
1,120
Sq Ft
$159/Sq Ft
Est. Value
About This Home
This home is located at 232 Lester Ave, Findlay, OH 45840 and is currently estimated at $178,559, approximately $159 per square foot. 232 Lester Ave is a home located in Hancock County with nearby schools including Northview Elementary School, Bigelow Hill Elementary School, and Glenwood Middle School.
Ownership History
Date
Name
Owned For
Owner Type
Purchase Details
Closed on
Jul 16, 2009
Sold by
Holzwart John W and Holzwart Amy N
Bought by
Terres Michael A and Terres Nichole A
Current Estimated Value
Home Financials for this Owner
Home Financials are based on the most recent Mortgage that was taken out on this home.
Original Mortgage
$101,495
Outstanding Balance
$66,195
Interest Rate
5.62%
Mortgage Type
FHA
Estimated Equity
$112,364
Purchase Details
Closed on
Dec 20, 2001
Sold by
Robinson Mark D
Bought by
Holzwart John W and Orton Amy N
Home Financials for this Owner
Home Financials are based on the most recent Mortgage that was taken out on this home.
Original Mortgage
$87,300
Interest Rate
6.52%
Mortgage Type
New Conventional
Purchase Details
Closed on
Dec 10, 1990
Bought by
Robinson Mark D
Purchase Details
Closed on
Apr 11, 1989
Bought by
Toland Carl E and Toland Donna A
Purchase Details
Closed on
Aug 4, 1986
Bought by
Sadler Virginia L
Create a Home Valuation Report for This Property
The Home Valuation Report is an in-depth analysis detailing your home's value as well as a comparison with similar homes in the area
Home Values in the Area
Average Home Value in this Area
Purchase History
| Date | Buyer | Sale Price | Title Company |
|---|---|---|---|
| Terres Michael A | $105,000 | Mid American Title | |
| Holzwart John W | $90,000 | -- | |
| Robinson Mark D | $65,900 | -- | |
| Toland Carl E | $11,800 | -- | |
| Sadler Virginia L | -- | -- |
Source: Public Records
Mortgage History
| Date | Status | Borrower | Loan Amount |
|---|---|---|---|
| Open | Terres Michael A | $101,495 | |
| Closed | Holzwart John W | $87,300 |
Source: Public Records
Tax History
| Year | Tax Paid | Tax Assessment Tax Assessment Total Assessment is a certain percentage of the fair market value that is determined by local assessors to be the total taxable value of land and additions on the property. | Land | Improvement |
|---|---|---|---|---|
| 2024 | $1,916 | $53,950 | $4,880 | $49,070 |
| 2023 | $1,919 | $53,950 | $4,880 | $49,070 |
| 2022 | $1,920 | $53,950 | $4,880 | $49,070 |
| 2021 | $1,897 | $46,610 | $4,880 | $41,730 |
| 2020 | $1,897 | $46,610 | $4,880 | $41,730 |
| 2019 | $1,997 | $46,610 | $4,880 | $41,730 |
| 2018 | $1,791 | $38,670 | $3,900 | $34,770 |
| 2017 | $1,681 | $38,670 | $3,900 | $34,770 |
| 2016 | $1,662 | $38,670 | $3,900 | $34,770 |
| 2015 | $1,214 | $27,760 | $3,900 | $23,860 |
| 2014 | $1,214 | $27,760 | $3,900 | $23,860 |
| 2012 | $1,315 | $29,840 | $3,900 | $25,940 |
Source: Public Records
Map
Nearby Homes
- 239 Edith Ave
- 232 Prentiss Ave
- 315 W Melrose Ave
- 329 W Melrose Ave
- 217 Prentiss Ave
- 146 Clifton Ave
- 140 Monroe Ave
- 2400 Hollybrook Dr
- 421 Clifton Ave
- 528 Rector Ave
- 145 Madison Ave
- 400 Rosewood Ave
- 245 Edinborough Dr
- 636 W Melrose Ave
- 701 W Melrose Ave
- 2605 Eton Place
- 2604 N Main St
- 724 Edith Ave
- 241 Stanley Ave
- 128 Harrington Ave
- 228 Lester Ave
- 300 Lester Ave
- 224 Lester Ave
- 304 Lester Ave
- 222 Lester Ave
- 301 Edith Ave
- 235 Edith Ave
- 308 Lester Ave
- 305 Edith Ave
- 231 Edith Ave
- 220 Lester Ave
- 301 Lester Ave Unit 305
- 311 Edith Ave
- 245 Lester Ave
- 312 Lester Ave
- 301-305 Lester Ave
- 227 Edith Ave
- 241 Lester Ave
- 311 Lester Ave
- 315 Edith Ave
Your Personal Tour Guide
Ask me questions while you tour the home.