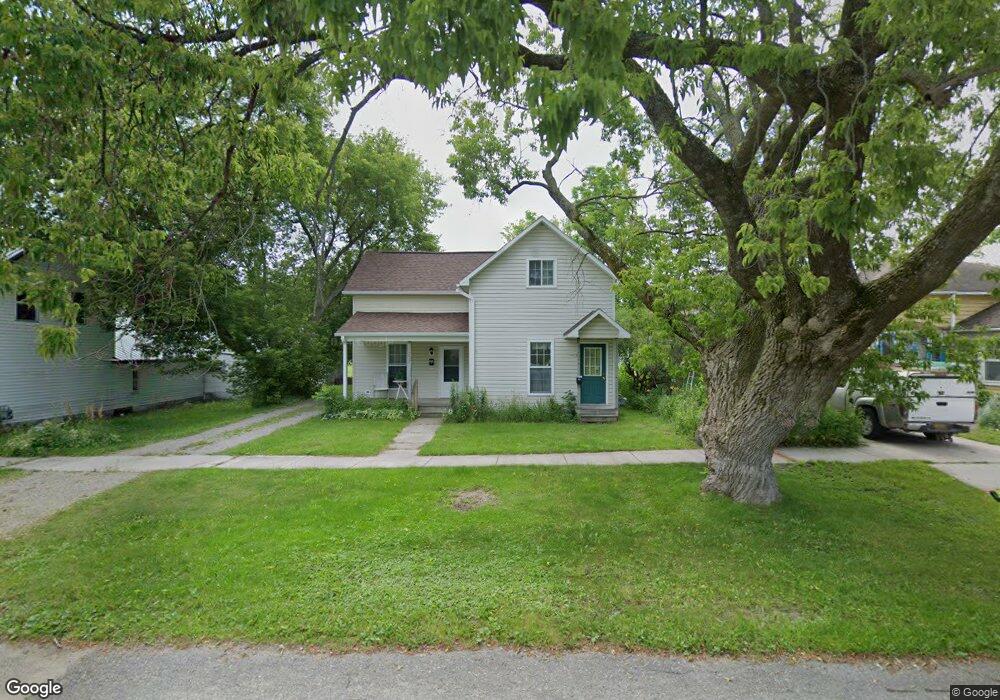
232 N E St Unit (Also 232A N E St) Cheboygan, MI 49721
Estimated Value: $148,000 - $182,000
Studio
--
Bath
1,868
Sq Ft
$87/Sq Ft
Est. Value
About This Home
This home is located at 232 N E St Unit (Also 232A N E St), Cheboygan, MI 49721 and is currently estimated at $162,650, approximately $87 per square foot. 232 N E St Unit (Also 232A N E St) is a home located in Cheboygan County with nearby schools including East Elementary School, Cheboygan Intermediate School, and Cheboygan Area High School.
Ownership History
Date
Name
Owned For
Owner Type
Purchase Details
Closed on
Nov 13, 2025
Sold by
Feldmann Elizabeth C Trust
Bought by
Feldmann Elizabeth C Trust Fbo Amy Loui
Current Estimated Value
Purchase Details
Closed on
Jun 1, 2022
Sold by
Hughey Darwin
Bought by
Feldmann Elizabeth C Trust
Purchase Details
Closed on
Jun 23, 2021
Sold by
Bodwin Doris A
Bought by
Hughey Darwin and Hughey Martha
Purchase Details
Closed on
Dec 18, 2015
Sold by
Bodwin Doris A and Bodwin George
Bought by
Bodwin Doris A and Bodwin George
Purchase Details
Closed on
Oct 23, 2015
Sold by
Last Betty and Last Gregory
Bought by
Bodwin Doris A and Bodwin George
Create a Home Valuation Report for This Property
The Home Valuation Report is an in-depth analysis detailing your home's value as well as a comparison with similar homes in the area
Home Values in the Area
Average Home Value in this Area
Purchase History
| Date | Buyer | Sale Price | Title Company |
|---|---|---|---|
| Feldmann Elizabeth C Trust Fbo Amy Loui | -- | -- | |
| Feldmann Elizabeth C Trust | $150,000 | -- | |
| Hughey Darwin | -- | -- | |
| Bodwin Doris A | -- | None Available | |
| Bodwin Doris A | $63,500 | None Available |
Source: Public Records
Tax History
| Year | Tax Paid | Tax Assessment Tax Assessment Total Assessment is a certain percentage of the fair market value that is determined by local assessors to be the total taxable value of land and additions on the property. | Land | Improvement |
|---|---|---|---|---|
| 2025 | $2,189 | $47,200 | $0 | $0 |
| 2024 | $1,778 | $39,900 | $0 | $0 |
| 2023 | $1,702 | $34,800 | $0 | $0 |
| 2022 | $688 | $26,300 | $0 | $0 |
| 2021 | $883 | $23,200 | $23,200 | $0 |
| 2020 | $875 | $23,200 | $23,200 | $0 |
| 2019 | $853 | $21,900 | $21,900 | $0 |
| 2018 | $831 | $21,200 | $0 | $0 |
| 2017 | $803 | $21,100 | $0 | $0 |
| 2016 | $794 | $19,600 | $0 | $0 |
| 2015 | -- | $17,400 | $0 | $0 |
| 2014 | -- | $16,600 | $0 | $0 |
| 2012 | -- | $16,100 | $0 | $0 |
Source: Public Records
Map
Nearby Homes
- 260 Duncan Ave
- Lot 9 U S 23
- 13935 U S 23
- Lot 14 U S 23
- 208 S F St
- 421 Sutherland St
- 415 George St
- 509 W 1st St
- 300 Cass St
- 219 S Main St
- V/L 55-+AC E State St
- 502 S Huron St
- 1019 Mackinaw Ave
- 172 E Lincoln Ave
- 202 S Western Ave
- 178 Riverside Dr
- 115 Boat Club Dr
- 158 Boat Club Dr
- 162 Boat Club Dr
- 90 Boat Club Dr
Your Personal Tour Guide
Ask me questions while you tour the home.