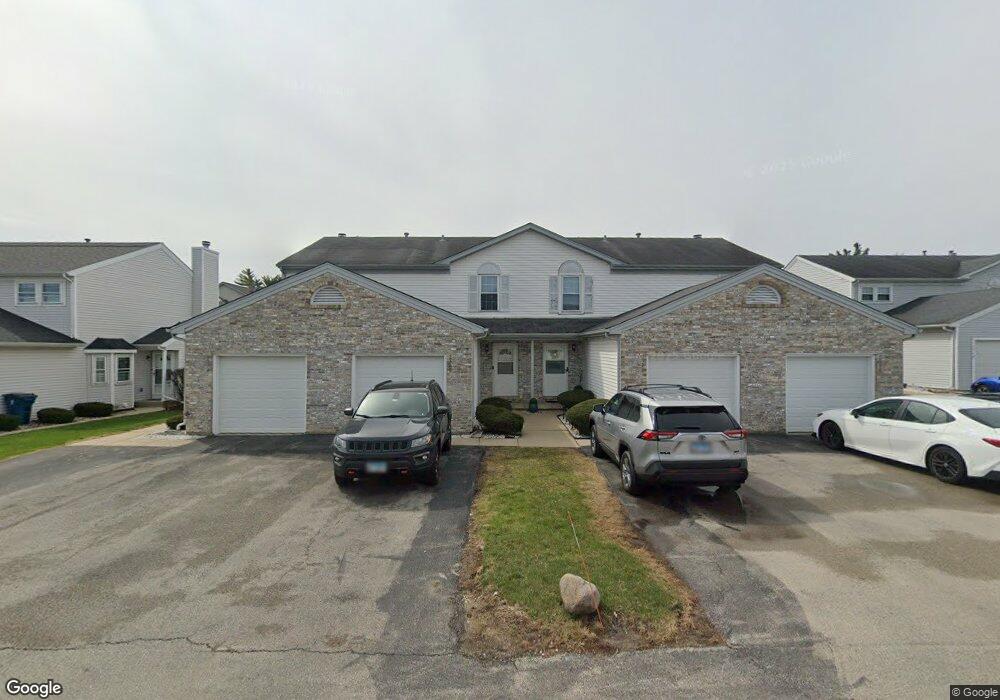
232 N Walnut St Unit D Bensenville, IL 60106
Estimated Value: $242,390
Studio
1
Bath
1,088
Sq Ft
$223/Sq Ft
Est. Value
About This Home
This home is located at 232 N Walnut St Unit D, Bensenville, IL 60106 and is currently priced at $242,390, approximately $222 per square foot. 232 N Walnut St Unit D is a home located in DuPage County with nearby schools including Tioga Elementary School, Blackhawk Middle School, and Fenton High School.
Ownership History
Date
Name
Owned For
Owner Type
Purchase Details
Closed on
Dec 29, 2020
Sold by
Nationstar Mortgage Llc
Bought by
Al Qayam Llc
Current Estimated Value
Purchase Details
Closed on
Jun 17, 2019
Sold by
Knorrek Robert E
Bought by
Nationstar Mortgage Llc and Mr Cooper
Purchase Details
Closed on
Jan 21, 1998
Sold by
Witchek Pamela
Bought by
Knorrek Robert E
Home Financials for this Owner
Home Financials are based on the most recent Mortgage that was taken out on this home.
Original Mortgage
$118,814
Interest Rate
7.16%
Mortgage Type
FHA
Create a Home Valuation Report for This Property
The Home Valuation Report is an in-depth analysis detailing your home's value as well as a comparison with similar homes in the area
Home Values in the Area
Average Home Value in this Area
Purchase History
| Date | Buyer | Sale Price | Title Company |
|---|---|---|---|
| Al Qayam Llc | $145,000 | Title365 | |
| Nationstar Mortgage Llc | -- | Attorney | |
| Knorrek Robert E | $120,000 | First American Title |
Source: Public Records
Mortgage History
| Date | Status | Borrower | Loan Amount |
|---|---|---|---|
| Previous Owner | Knorrek Robert E | $118,814 |
Source: Public Records
Tax History
| Year | Tax Paid | Tax Assessment Tax Assessment Total Assessment is a certain percentage of the fair market value that is determined by local assessors to be the total taxable value of land and additions on the property. | Land | Improvement |
|---|---|---|---|---|
| 2024 | $6,329 | $72,796 | $11,694 | $61,102 |
| 2023 | $6,032 | $66,920 | $10,750 | $56,170 |
| 2022 | $5,576 | $61,300 | $9,850 | $51,450 |
| 2021 | $4,761 | $58,710 | $9,430 | $49,280 |
| 2020 | $4,606 | $56,230 | $9,030 | $47,200 |
| 2019 | $4,333 | $54,060 | $8,680 | $45,380 |
| 2018 | $4,101 | $50,700 | $8,680 | $42,020 |
| 2017 | $3,957 | $48,460 | $8,300 | $40,160 |
| 2016 | $3,781 | $44,740 | $7,660 | $37,080 |
| 2015 | $3,649 | $41,330 | $7,080 | $34,250 |
| 2014 | $4,158 | $45,930 | $7,870 | $38,060 |
| 2013 | $4,125 | $46,870 | $8,030 | $38,840 |
Source: Public Records
Map
Nearby Homes
- 214 N Walnut St
- 801 W Main St
- 128 N York Rd
- 1015 Glendale St
- 434 Gaylin Ct
- 147 S Addison St
- 11 W Green St Unit 704
- 5N184 Illinois 83
- 227-239 W Irving Park Rd
- 224 Spruce Ave
- 125 N Spruce Ave
- 245 S Addison St
- 440 E Montrose Ave Unit 402
- 345 Ash Ave
- 139 N Hemlock Ave
- 445 S Ellis St
- 000 Lot#1 Ridgewood Ave
- 398 Woodlane Ct
- 334 Park St
- 388 Preserve Ln
- 232 N Walnut St Unit B
- 232 N Walnut St Unit A
- 232 N Walnut St Unit 22
- 232 N Walnut St
- 233 Poppy Ln
- 229 Poppy Ln
- 230 N Walnut St Unit C
- 230 N Walnut St
- 230 N Walnut St Unit D
- 230 N Walnut St Unit B
- 230 N Walnut St Unit A
- 224 N Walnut St Unit B
- 224 N Walnut St Unit A
- 224 N Walnut St Unit 3
- 224 N Walnut St Unit E
- 224 N Walnut St Unit C
- 224 N Walnut St Unit F
- 235 Poppy Ln
- 236 N Walnut St Unit D
- 236 N Walnut St Unit B
Your Personal Tour Guide
Ask me questions while you tour the home.