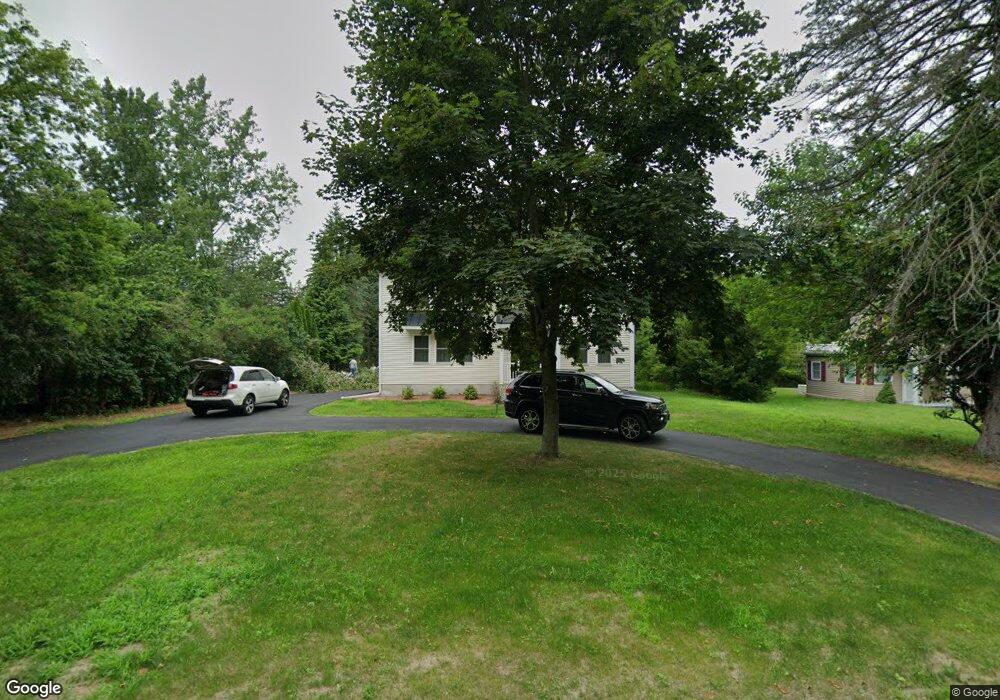
232 Nashua Rd Dracut, MA 01826
Estimated Value: $510,000 - $869,226
4
Beds
1
Bath
1,448
Sq Ft
$527/Sq Ft
Est. Value
About This Home
This home is located at 232 Nashua Rd, Dracut, MA 01826 and is currently estimated at $763,057, approximately $526 per square foot. 232 Nashua Rd is a home located in Middlesex County with nearby schools including Brookside Elementary School, Richardson Middle School, and Dracut Senior High School.
Ownership History
Date
Name
Owned For
Owner Type
Purchase Details
Closed on
May 7, 2025
Sold by
Citywide Properties Llc
Bought by
Mume Sheila N and Akom Walters
Current Estimated Value
Home Financials for this Owner
Home Financials are based on the most recent Mortgage that was taken out on this home.
Original Mortgage
$805,147
Outstanding Balance
$800,846
Interest Rate
6.65%
Mortgage Type
FHA
Estimated Equity
-$37,789
Purchase Details
Closed on
Jun 21, 2023
Sold by
Bowler Nathan D and Bowler Anne M
Bought by
Citywide Properties Llc
Purchase Details
Closed on
Jan 30, 2004
Sold by
Levasseur Marie P and Levasseur Robert
Bought by
Bowler Nathan D and Bowler Anne Marie
Home Financials for this Owner
Home Financials are based on the most recent Mortgage that was taken out on this home.
Original Mortgage
$242,691
Interest Rate
5.82%
Mortgage Type
Purchase Money Mortgage
Create a Home Valuation Report for This Property
The Home Valuation Report is an in-depth analysis detailing your home's value as well as a comparison with similar homes in the area
Home Values in the Area
Average Home Value in this Area
Purchase History
| Date | Buyer | Sale Price | Title Company |
|---|---|---|---|
| Mume Sheila N | $820,000 | None Available | |
| Mume Sheila N | $820,000 | None Available | |
| Citywide Properties Llc | $205,000 | None Available | |
| Citywide Properties Llc | $205,000 | None Available | |
| Bowler Nathan D | $246,500 | -- | |
| Bowler Nathan D | $246,500 | -- | |
| Bowler Nathan D | $246,500 | -- |
Source: Public Records
Mortgage History
| Date | Status | Borrower | Loan Amount |
|---|---|---|---|
| Open | Mume Sheila N | $805,147 | |
| Closed | Mume Sheila N | $805,147 | |
| Previous Owner | Bowler Nathan D | $242,691 |
Source: Public Records
Tax History Compared to Growth
Tax History
| Year | Tax Paid | Tax Assessment Tax Assessment Total Assessment is a certain percentage of the fair market value that is determined by local assessors to be the total taxable value of land and additions on the property. | Land | Improvement |
|---|---|---|---|---|
| 2025 | $5,649 | $558,200 | $219,000 | $339,200 |
| 2024 | $4,241 | $405,800 | $208,500 | $197,300 |
| 2023 | $4,090 | $353,200 | $181,200 | $172,000 |
| 2022 | $3,982 | $324,000 | $164,700 | $159,300 |
| 2021 | $7,683 | $296,400 | $149,700 | $146,700 |
| 2020 | $3,751 | $281,000 | $145,200 | $135,800 |
| 2019 | $3,795 | $276,000 | $138,300 | $137,700 |
| 2018 | $3,726 | $263,500 | $138,300 | $125,200 |
| 2017 | $3,557 | $263,500 | $138,300 | $125,200 |
| 2016 | $3,455 | $232,800 | $132,900 | $99,900 |
| 2015 | $3,401 | $227,800 | $132,900 | $94,900 |
| 2014 | $3,241 | $223,700 | $132,900 | $90,800 |
Source: Public Records
Map
Nearby Homes
- 25 Settlers Way
- 124 Tennis Plaza Rd Unit 22
- 11 Arbor Dr
- 29 Mill St Unit B
- 29 Wimbledon Crossing
- 94 Tennis Plaza Rd Unit 10
- 84 Tennis Plaza Rd Unit 64
- 17 Spare St
- 16 Wiggin Terrace
- 1905 Lakeview Ave
- 74 Tennis Plaza Rd Unit 34
- 625 Mammoth Rd
- 53 Vinal St
- 10 Edwards St
- 671 Nashua Rd
- 14 Trotting Park Rd
- 135 Stewart St Unit 1
- 57 Lantern Ln Unit 3
- 12 Trotting Park Rd
- 109 Navy Yard Rd