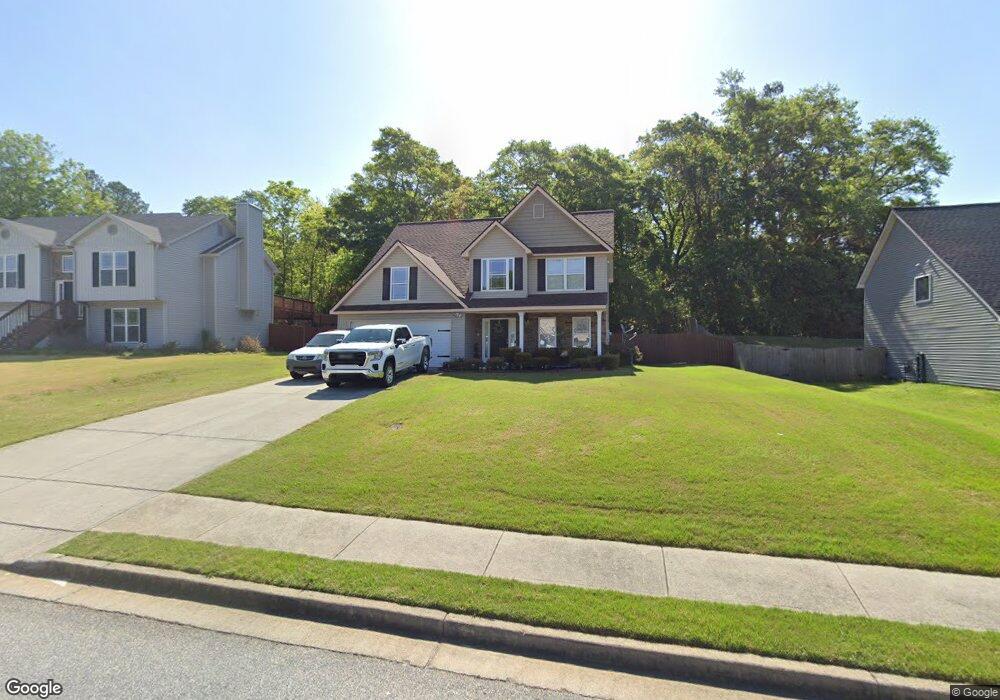
232 Oceanliner Dr Winder, GA 30680
Estimated Value: $323,000 - $345,000
Studio
3
Baths
1,976
Sq Ft
$168/Sq Ft
Est. Value
About This Home
This home is located at 232 Oceanliner Dr, Winder, GA 30680 and is currently estimated at $331,240, approximately $167 per square foot. 232 Oceanliner Dr is a home located in Barrow County with nearby schools including Kennedy Elementary School, Westside Middle School, and Apalachee High School.
Ownership History
Date
Name
Owned For
Owner Type
Purchase Details
Closed on
Dec 4, 2006
Sold by
Damascus Hms Llc
Bought by
Heard Vince B and Heard Laphyllis J
Current Estimated Value
Home Financials for this Owner
Home Financials are based on the most recent Mortgage that was taken out on this home.
Original Mortgage
$158,827
Outstanding Balance
$93,761
Interest Rate
6.36%
Mortgage Type
FHA
Estimated Equity
$237,479
Purchase Details
Closed on
Oct 16, 2006
Sold by
Eastside Holdings Llc
Bought by
Damascus Homes Llc
Home Financials for this Owner
Home Financials are based on the most recent Mortgage that was taken out on this home.
Original Mortgage
$158,827
Outstanding Balance
$93,761
Interest Rate
6.36%
Mortgage Type
FHA
Estimated Equity
$237,479
Purchase Details
Closed on
Jul 16, 2004
Sold by
Langley Properties Inc
Bought by
Eastside Holdings Llc
Purchase Details
Closed on
Apr 4, 2003
Bought by
Langley Properties Inc
Create a Home Valuation Report for This Property
The Home Valuation Report is an in-depth analysis detailing your home's value as well as a comparison with similar homes in the area
Home Values in the Area
Average Home Value in this Area
Purchase History
| Date | Buyer | Sale Price | Title Company |
|---|---|---|---|
| Heard Vince B | $161,400 | -- | |
| Damascus Homes Llc | $38,500 | -- | |
| Eastside Holdings Llc | $36,500 | -- | |
| Langley Properties Inc | -- | -- |
Source: Public Records
Mortgage History
| Date | Status | Borrower | Loan Amount |
|---|---|---|---|
| Open | Heard Vince B | $158,827 |
Source: Public Records
Tax History
| Year | Tax Paid | Tax Assessment Tax Assessment Total Assessment is a certain percentage of the fair market value that is determined by local assessors to be the total taxable value of land and additions on the property. | Land | Improvement |
|---|---|---|---|---|
| 2025 | $1,220 | $105,464 | $25,600 | $79,864 |
| 2024 | $2,818 | $103,080 | $25,600 | $77,480 |
| 2023 | $2,312 | $102,280 | $24,800 | $77,480 |
| 2022 | $3,103 | $95,790 | $21,600 | $74,190 |
| 2021 | $2,584 | $77,154 | $16,800 | $60,354 |
| 2020 | $2,192 | $67,437 | $14,000 | $53,437 |
| 2019 | $1,993 | $60,519 | $14,000 | $46,519 |
| 2018 | $1,918 | $58,519 | $12,000 | $46,519 |
| 2017 | $1,523 | $51,040 | $12,000 | $39,040 |
| 2016 | $1,354 | $44,084 | $12,000 | $32,084 |
| 2015 | $1,367 | $44,429 | $12,000 | $32,429 |
| 2014 | $1,211 | $40,417 | $7,644 | $32,773 |
| 2013 | -- | $41,686 | $7,644 | $34,042 |
Source: Public Records
Map
Nearby Homes
- 245 Oceanliner Dr
- 375 Searchlight Dr
- 253 Woodland Dr
- 1102 Sutherland Dr
- 1301 Dianne Way
- 0 Gordon Ct Unit 10634940
- 0 Atlanta Hwy SE Unit 10371310
- 1230 Dianne Dr
- 0 E Midland Ave Unit 7743047
- 211 Brooks Ln
- 1048 Sutherland Dr
- 242 Monroe Hwy
- 31 Huckleberry Ln
- 39 Huckleberry Ln
- 252 Eastbrook Dr
- 163 Wood Cir
- 295 E Wright St
- 24 Richardson St
- 88 E Stephens St
- 0 Cedar Grove Church Rd Lot 30 Unit 10730063
- 234 Oceanliner Dr
- 234 Oceanliner Dr Unit 1
- 230 Oceanliner Dr Unit 103
- 230 Oceanliner Dr
- 236 Oceanliner Dr
- 228 Oceanliner Dr
- 231 Oceanliner Dr Unit /72
- 231 Oceanliner Dr
- 233 Oceanliner Dr
- 238 Oceanliner Dr
- 229 Oceanliner Dr
- 235 Oceanliner Dr
- 226 Oceanliner Dr
- 242 Oceanliner Dr
- 237 Oceanliner Dr
- 224 Oceanliner Dr
- 271 Searchlight Dr
- 351 Searchlight Dr
- 244 Oceanliner Dr Unit 97
- 244 Oceanliner Dr
Your Personal Tour Guide
Ask me questions while you tour the home.