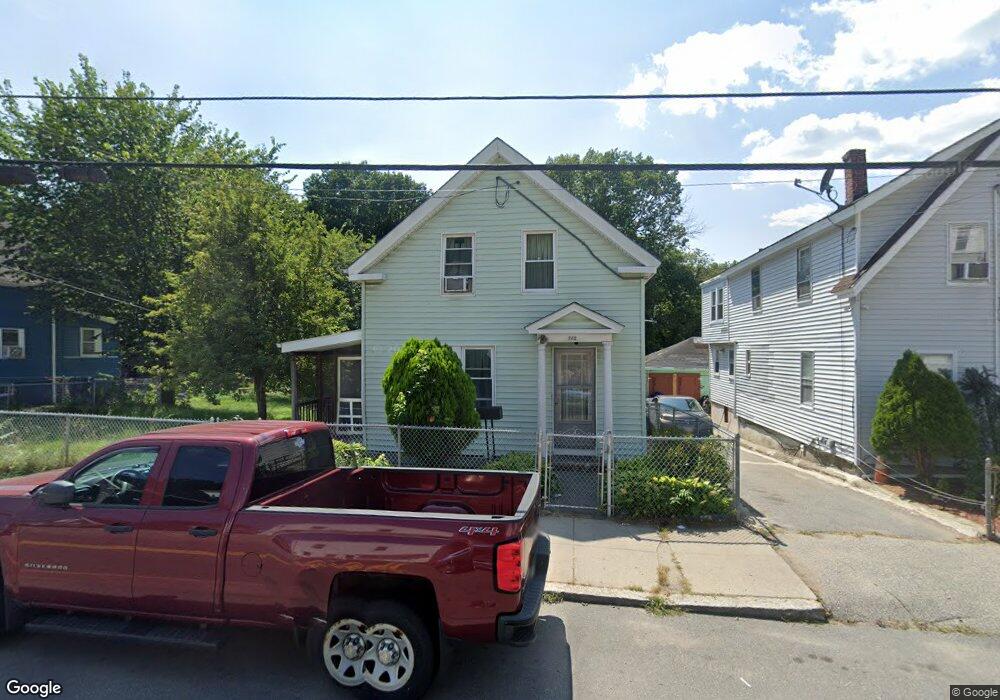
232 Prospect St Lawrence, MA 01841
Prospect Hill-Back Bay NeighborhoodEstimated Value: $462,000 - $538,000
3
Beds
3
Baths
1,384
Sq Ft
$359/Sq Ft
Est. Value
About This Home
This home is located at 232 Prospect St, Lawrence, MA 01841 and is currently estimated at $496,371, approximately $358 per square foot. 232 Prospect St is a home located in Essex County with nearby schools including School For Exceptional Studies, Community Day Charter Public School - Gateway, and Esperanza Academy School of Hope.
Ownership History
Date
Name
Owned For
Owner Type
Purchase Details
Closed on
Jun 24, 2005
Sold by
Decenzo Doreen
Bought by
Obasa Olabisi and Lightfoot Onessimus M
Current Estimated Value
Home Financials for this Owner
Home Financials are based on the most recent Mortgage that was taken out on this home.
Original Mortgage
$166,250
Outstanding Balance
$87,127
Interest Rate
5.82%
Mortgage Type
Purchase Money Mortgage
Estimated Equity
$409,244
Create a Home Valuation Report for This Property
The Home Valuation Report is an in-depth analysis detailing your home's value as well as a comparison with similar homes in the area
Home Values in the Area
Average Home Value in this Area
Purchase History
| Date | Buyer | Sale Price | Title Company |
|---|---|---|---|
| Obasa Olabisi | $175,000 | -- |
Source: Public Records
Mortgage History
| Date | Status | Borrower | Loan Amount |
|---|---|---|---|
| Open | Obasa Olabisi | $166,250 |
Source: Public Records
Tax History
| Year | Tax Paid | Tax Assessment Tax Assessment Total Assessment is a certain percentage of the fair market value that is determined by local assessors to be the total taxable value of land and additions on the property. | Land | Improvement |
|---|---|---|---|---|
| 2025 | $3,814 | $433,400 | $149,000 | $284,400 |
| 2024 | $3,575 | $386,500 | $154,500 | $232,000 |
| 2023 | $3,790 | $373,000 | $149,300 | $223,700 |
| 2022 | $3,634 | $317,700 | $141,000 | $176,700 |
| 2021 | $3,574 | $291,300 | $141,000 | $150,300 |
| 2020 | $3,336 | $268,400 | $118,100 | $150,300 |
| 2019 | $3,068 | $224,300 | $88,500 | $135,800 |
| 2018 | $2,691 | $187,900 | $80,500 | $107,400 |
| 2017 | $2,576 | $167,900 | $75,500 | $92,400 |
| 2016 | $2,491 | $160,600 | $59,500 | $101,100 |
| 2015 | $2,428 | $160,600 | $59,500 | $101,100 |
Source: Public Records
Map
Nearby Homes
- 192 Union St
- 144 Ferry St
- 89 Newbury St Unit 89B
- 94 Summer St
- 32 Orchard St
- 2 Leslie St
- 131A Lawrence St Unit 40
- 39 Swan Ave
- 106 Leroy Ave
- 264 E Haverhill St Unit 2
- 11 Lawrence St Unit 606
- 129-131 Lexington St
- 52 Howard St
- 7 Stevens Ct
- 7-9 Bennington St
- 12 Annette St
- 27 Woodland Ct
- 46 Amesbury St Unit 2B
- 18 Erhardt Terrace
- 169 Berkeley St
- 234 Prospect St
- 222 Prospect St
- 236 Prospect St
- 218 Prospect St
- 242 Prospect St
- 242 Prospect St Unit A
- 242A Prospect St
- 210 Prospect St Unit 216
- 210 Prospect St
- 223 Prospect St
- 246 Prospect St
- 202 Prospect St Unit 206
- 206 Prospect St
- 221 Prospect St
- 252 Prospect St Unit 3
- 227 Prospect St
- 233 Prospect St
- 215 Prospect St
- 241 Prospect St Unit 243
- 235-237 Prospect St
Your Personal Tour Guide
Ask me questions while you tour the home.