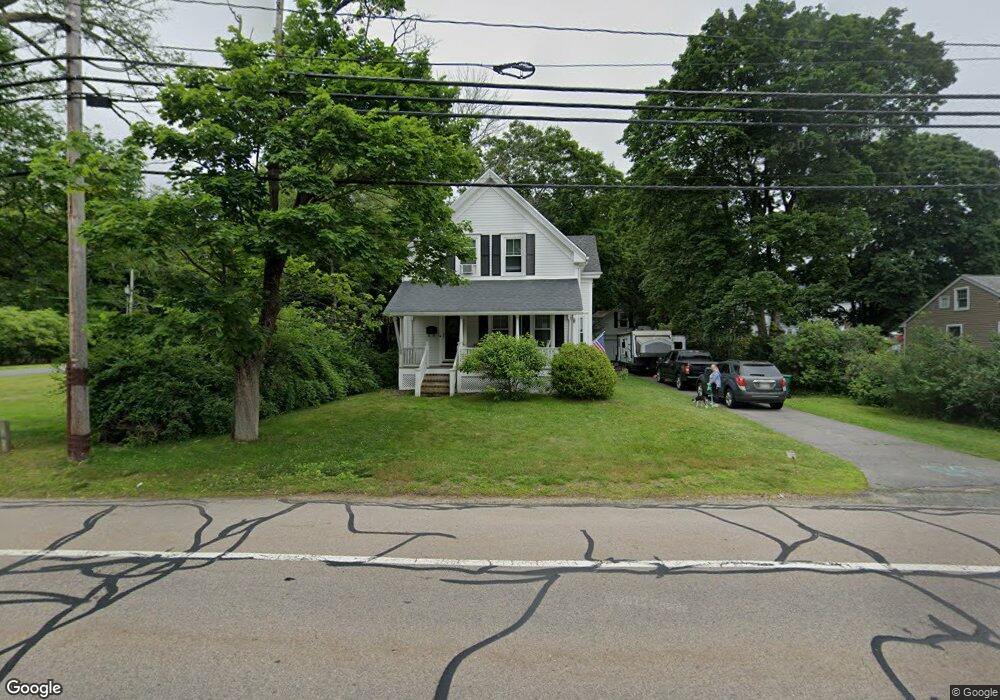
232 S Main St Mansfield, MA 02048
Estimated Value: $624,708 - $759,000
4
Beds
2
Baths
1,822
Sq Ft
$384/Sq Ft
Est. Value
About This Home
This home is located at 232 S Main St, Mansfield, MA 02048 and is currently estimated at $699,177, approximately $383 per square foot. 232 S Main St is a home located in Bristol County with nearby schools including Everett W. Robinson Elementary School, Jordan/Jackson Elementary School, and Harold L. Qualters Middle School.
Ownership History
Date
Name
Owned For
Owner Type
Purchase Details
Closed on
Mar 27, 2007
Sold by
Bernard Phyllis and Forbes Elizabeth D
Bought by
Farnham Scott C and Farnham Kathleen B
Current Estimated Value
Home Financials for this Owner
Home Financials are based on the most recent Mortgage that was taken out on this home.
Original Mortgage
$241,600
Outstanding Balance
$146,071
Interest Rate
6.33%
Mortgage Type
Purchase Money Mortgage
Estimated Equity
$553,106
Create a Home Valuation Report for This Property
The Home Valuation Report is an in-depth analysis detailing your home's value as well as a comparison with similar homes in the area
Home Values in the Area
Average Home Value in this Area
Purchase History
| Date | Buyer | Sale Price | Title Company |
|---|---|---|---|
| Farnham Scott C | $302,000 | -- |
Source: Public Records
Mortgage History
| Date | Status | Borrower | Loan Amount |
|---|---|---|---|
| Open | Farnham Scott C | $241,600 |
Source: Public Records
Tax History
| Year | Tax Paid | Tax Assessment Tax Assessment Total Assessment is a certain percentage of the fair market value that is determined by local assessors to be the total taxable value of land and additions on the property. | Land | Improvement |
|---|---|---|---|---|
| 2025 | $7,084 | $537,900 | $234,900 | $303,000 |
| 2024 | $6,963 | $515,800 | $234,900 | $280,900 |
| 2023 | $6,715 | $476,600 | $234,900 | $241,700 |
| 2022 | $6,643 | $437,900 | $217,500 | $220,400 |
| 2021 | $5,881 | $382,900 | $190,400 | $192,500 |
| 2020 | $5,348 | $348,200 | $181,300 | $166,900 |
| 2019 | $5,176 | $340,100 | $151,000 | $189,100 |
| 2018 | $5,051 | $324,400 | $143,900 | $180,500 |
| 2017 | $4,758 | $316,800 | $139,700 | $177,100 |
| 2016 | $4,259 | $276,400 | $133,000 | $143,400 |
| 2015 | $4,092 | $264,000 | $133,000 | $131,000 |
Source: Public Records
Map
Nearby Homes
- 44 Fairfield Park Unit 44
- 97 East St
- 28 Court St
- 7 Fieldstone Dr
- 1 Deer Path Ln
- 46 Hope St
- 150 Rumford Ave Unit 110
- 460 Ware St
- 266 N Main St Unit 3
- 571 Ware St
- 152 Central St
- 22 Pleasant St Unit C
- 81 Chilson Ave
- 14 Windchime Dr
- 166 Chauncy St
- 25 Kingman Ave
- 19 Barberry Rd
- 619 N Main St
- 4 Concetta Cir
- 1769 West St
Your Personal Tour Guide
Ask me questions while you tour the home.