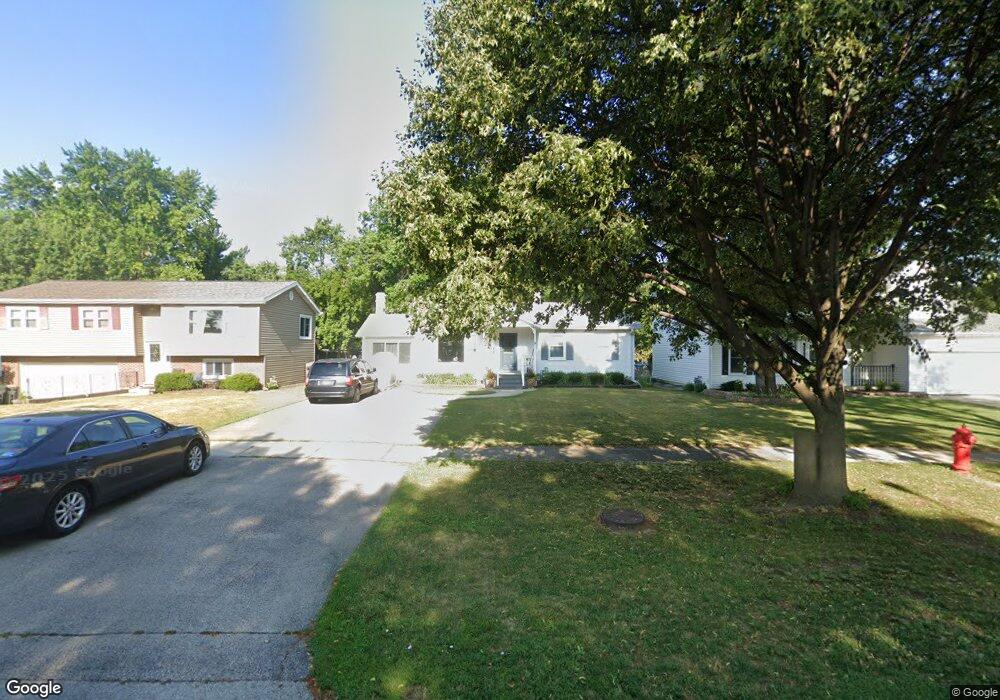
232 S Rohlwing Rd Palatine, IL 60074
Downtown Palatine NeighborhoodEstimated Value: $292,000 - $415,000
2
Beds
1
Bath
733
Sq Ft
$478/Sq Ft
Est. Value
About This Home
This home is located at 232 S Rohlwing Rd, Palatine, IL 60074 and is currently estimated at $350,448, approximately $478 per square foot. 232 S Rohlwing Rd is a home located in Cook County with nearby schools including Virginia Lake Elementary School, Palatine High School, and Immanuel Lutheran School.
Ownership History
Date
Name
Owned For
Owner Type
Purchase Details
Closed on
Dec 13, 2021
Sold by
Roehrborn Daniel H and Roehrborn Denise A
Bought by
Roehrborn Daniel H and Roehrborn Denise A
Current Estimated Value
Purchase Details
Closed on
Apr 5, 1996
Sold by
John R Thomas Company
Bought by
Roehrborn Daniel H and Roehrborn Denise A
Home Financials for this Owner
Home Financials are based on the most recent Mortgage that was taken out on this home.
Original Mortgage
$117,900
Outstanding Balance
$3,228
Interest Rate
7.44%
Estimated Equity
$347,220
Create a Home Valuation Report for This Property
The Home Valuation Report is an in-depth analysis detailing your home's value as well as a comparison with similar homes in the area
Home Values in the Area
Average Home Value in this Area
Purchase History
| Date | Buyer | Sale Price | Title Company |
|---|---|---|---|
| Roehrborn Daniel H | -- | None Available | |
| Roehrborn Daniel H | $131,000 | -- |
Source: Public Records
Mortgage History
| Date | Status | Borrower | Loan Amount |
|---|---|---|---|
| Open | Roehrborn Daniel H | $117,900 |
Source: Public Records
Tax History
| Year | Tax Paid | Tax Assessment Tax Assessment Total Assessment is a certain percentage of the fair market value that is determined by local assessors to be the total taxable value of land and additions on the property. | Land | Improvement |
|---|---|---|---|---|
| 2025 | $5,466 | $25,000 | $7,560 | $17,440 |
| 2024 | $5,466 | $21,778 | $6,480 | $15,298 |
| 2023 | $5,258 | $21,778 | $6,480 | $15,298 |
| 2022 | $5,258 | $21,778 | $6,480 | $15,298 |
| 2021 | $4,427 | $16,960 | $3,780 | $13,180 |
| 2020 | $4,433 | $16,960 | $3,780 | $13,180 |
| 2019 | $4,433 | $18,887 | $3,780 | $15,107 |
| 2018 | $5,094 | $19,826 | $3,510 | $16,316 |
| 2017 | $5,016 | $19,826 | $3,510 | $16,316 |
| 2016 | $4,913 | $19,826 | $3,510 | $16,316 |
| 2015 | $4,533 | $17,376 | $3,240 | $14,136 |
| 2014 | $4,494 | $17,376 | $3,240 | $14,136 |
| 2013 | $4,361 | $17,376 | $3,240 | $14,136 |
Source: Public Records
Map
Nearby Homes
- 245 S Park Ln Unit 321
- 900 E Wilmette Rd Unit 218
- 909 E Kenilworth Ave Unit 321
- 909 E Kenilworth Ave Unit 420
- 263 S Clubhouse Dr Unit 205
- 263 S Clubhouse Dr Unit 304
- 950 E Wilmette Rd Unit 414
- 102 S Ashland Ave
- 14 S Stonington Dr Unit 32
- 45 S Stonington Dr Unit 4
- 27 S Stonington Dr Unit 172
- 126 N Rohlwing Rd
- 29 N Linden Ave
- 648 E Lincoln St
- 241 E Parallel St Unit 1A
- 649 E Eisenhower Ave
- 714 E Eisenhower Ave
- 315 S Oak St
- 353 N Clark Dr
- 306 N Schubert St
- 238 S Rohlwing Rd
- 226 S Rohlwing Rd
- 244 S Rohlwing Rd
- 220 S Rohlwing Rd
- 214 S Rohlwing Rd
- 250 S Rohlwing Rd
- 229 S Greenwood Ave
- 239 S Greenwood Ave
- 227 S Greenwood Ave
- 245 S Greenwood Ave
- 256 S Rohlwing Rd
- 215 S Greenwood Ave
- 251 S Greenwood Ave
- 747 E Kenilworth Ave
- 225 S Rohlwing Rd
- 225 S Rohlwing Rd Unit 311
- 225 S Rohlwing Rd Unit 412
- 225 S Rohlwing Rd Unit 605
- 225 S Rohlwing Rd Unit 407
- 225 S Rohlwing Rd Unit 616
Your Personal Tour Guide
Ask me questions while you tour the home.