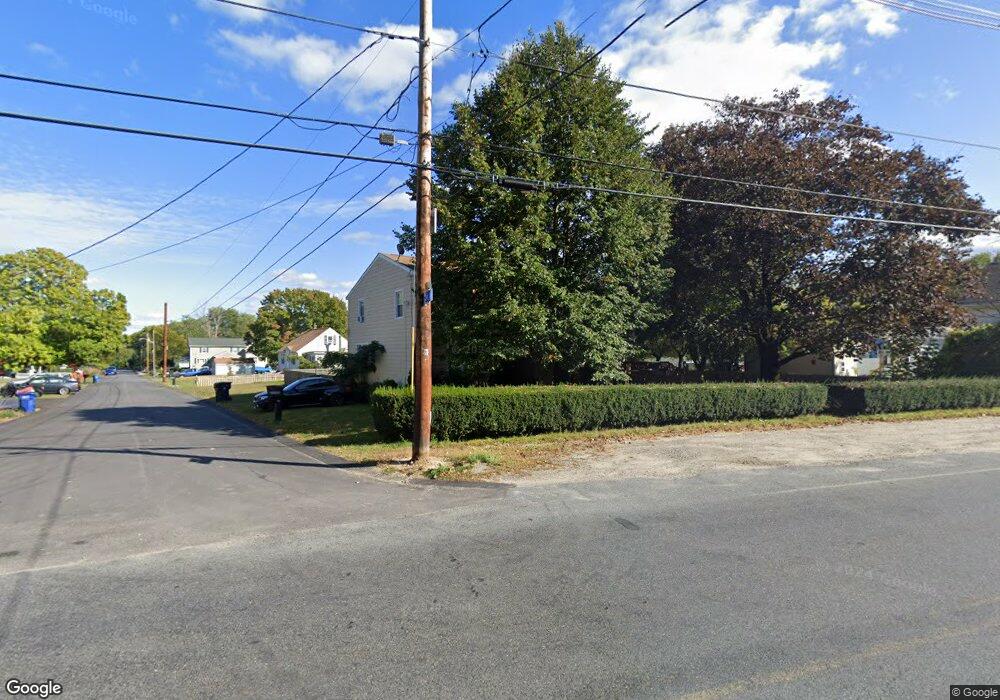
232 Sanford Rd Westport, MA 02790
North Westport NeighborhoodEstimated Value: $512,838 - $598,000
5
Beds
--
Bath
2,642
Sq Ft
$212/Sq Ft
Est. Value
About This Home
This home is located at 232 Sanford Rd, Westport, MA 02790 and is currently estimated at $560,210, approximately $212 per square foot. 232 Sanford Rd is a home located in Bristol County with nearby schools including Alice A. Macomber Primary School, Westport Elementary School, and Westport Middle-High School.
Ownership History
Date
Name
Owned For
Owner Type
Purchase Details
Closed on
Dec 31, 2020
Sold by
Anuszczyk Lisa
Bought by
Angom Jimmy S
Current Estimated Value
Home Financials for this Owner
Home Financials are based on the most recent Mortgage that was taken out on this home.
Original Mortgage
$275,488
Outstanding Balance
$245,831
Interest Rate
2.7%
Mortgage Type
FHA
Estimated Equity
$314,379
Purchase Details
Closed on
May 14, 2020
Sold by
Anuszczyk Lisa and Brown Lona A
Bought by
Anuszczyk Lisa
Purchase Details
Closed on
Nov 16, 2011
Sold by
Borges Antonio
Bought by
Anuszczyk Lisa and Brown Lona A
Purchase Details
Closed on
May 12, 1971
Bought by
Borges Antonio and Anuszczyk Lisa
Create a Home Valuation Report for This Property
The Home Valuation Report is an in-depth analysis detailing your home's value as well as a comparison with similar homes in the area
Home Values in the Area
Average Home Value in this Area
Purchase History
| Date | Buyer | Sale Price | Title Company |
|---|---|---|---|
| Angom Jimmy S | $285,000 | None Available | |
| Anuszczyk Lisa | -- | None Available | |
| Anuszczyk Lisa | -- | -- | |
| Borges Antonio | -- | -- |
Source: Public Records
Mortgage History
| Date | Status | Borrower | Loan Amount |
|---|---|---|---|
| Open | Angom Jimmy S | $275,488 | |
| Previous Owner | Borges Antonio | $41,360 | |
| Previous Owner | Borges Antonio | $33,000 |
Source: Public Records
Tax History Compared to Growth
Tax History
| Year | Tax Paid | Tax Assessment Tax Assessment Total Assessment is a certain percentage of the fair market value that is determined by local assessors to be the total taxable value of land and additions on the property. | Land | Improvement |
|---|---|---|---|---|
| 2025 | $2,925 | $392,600 | $165,400 | $227,200 |
| 2024 | $2,878 | $372,300 | $146,900 | $225,400 |
| 2023 | $2,864 | $351,000 | $133,800 | $217,200 |
| 2022 | $2,748 | $324,000 | $133,800 | $190,200 |
| 2021 | $2,633 | $305,400 | $110,600 | $194,800 |
| 2020 | $2,537 | $301,000 | $106,200 | $194,800 |
| 2019 | $2,492 | $301,300 | $106,200 | $195,100 |
| 2018 | $2,339 | $286,300 | $107,000 | $179,300 |
| 2017 | $2,204 | $276,500 | $103,600 | $172,900 |
| 2016 | $2,160 | $273,100 | $100,200 | $172,900 |
| 2015 | $2,005 | $252,800 | $102,500 | $150,300 |
Source: Public Records
Map
Nearby Homes