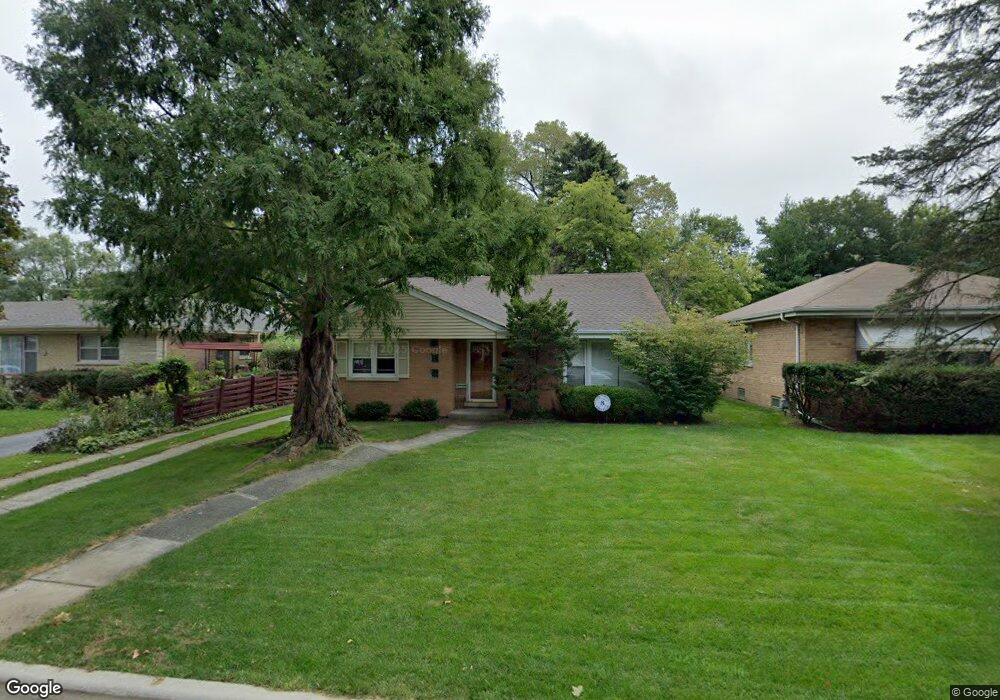
232 Thelin Ct Wilmette, IL 60091
Estimated Value: $417,000 - $510,000
3
Beds
2
Baths
1,119
Sq Ft
$416/Sq Ft
Est. Value
About This Home
This home is located at 232 Thelin Ct, Wilmette, IL 60091 and is currently estimated at $465,394, approximately $415 per square foot. 232 Thelin Ct is a home located in Cook County with nearby schools including Romona Elementary School, Highcrest Middle School, and Wilmette Junior High School.
Ownership History
Date
Name
Owned For
Owner Type
Purchase Details
Closed on
Jul 24, 2015
Sold by
Silver James
Bought by
Nathanson Bruce
Current Estimated Value
Purchase Details
Closed on
Feb 13, 2008
Sold by
Hsbc Bank Usa Na
Bought by
Nathanson Bruce and Silver James
Purchase Details
Closed on
Sep 11, 2007
Sold by
Uhm Ki Woong
Bought by
Hsbc Bank Usa Na and Home Equity Loan Trust Series Ace 2006-H
Purchase Details
Closed on
Dec 22, 2004
Sold by
Park Jong Yeoul and Park Hyun Ja
Bought by
Uhm Ki Woong
Home Financials for this Owner
Home Financials are based on the most recent Mortgage that was taken out on this home.
Original Mortgage
$400,000
Interest Rate
8.7%
Mortgage Type
Unknown
Purchase Details
Closed on
Apr 26, 2001
Sold by
Venema Maynard P and Venema Frances M
Bought by
Park Hyun Ja and Park Jong Yeoul
Home Financials for this Owner
Home Financials are based on the most recent Mortgage that was taken out on this home.
Original Mortgage
$226,400
Interest Rate
7%
Create a Home Valuation Report for This Property
The Home Valuation Report is an in-depth analysis detailing your home's value as well as a comparison with similar homes in the area
Home Values in the Area
Average Home Value in this Area
Purchase History
| Date | Buyer | Sale Price | Title Company |
|---|---|---|---|
| Nathanson Bruce | -- | None Available | |
| Nathanson Bruce | $275,000 | First American Title | |
| Hsbc Bank Usa Na | -- | None Available | |
| Uhm Ki Woong | $400,000 | -- | |
| Park Hyun Ja | $283,000 | -- |
Source: Public Records
Mortgage History
| Date | Status | Borrower | Loan Amount |
|---|---|---|---|
| Previous Owner | Uhm Ki Woong | $400,000 | |
| Previous Owner | Park Hyun Ja | $226,400 | |
| Closed | Park Hyun Ja | $28,300 |
Source: Public Records
Tax History Compared to Growth
Tax History
| Year | Tax Paid | Tax Assessment Tax Assessment Total Assessment is a certain percentage of the fair market value that is determined by local assessors to be the total taxable value of land and additions on the property. | Land | Improvement |
|---|---|---|---|---|
| 2024 | $7,077 | $31,189 | $12,600 | $18,589 |
| 2023 | $7,302 | $31,189 | $12,600 | $18,589 |
| 2022 | $7,302 | $34,000 | $12,600 | $21,400 |
| 2021 | $6,540 | $25,172 | $9,450 | $15,722 |
| 2020 | $6,433 | $25,172 | $9,450 | $15,722 |
| 2019 | $6,636 | $29,088 | $9,450 | $19,638 |
| 2018 | $5,823 | $24,477 | $8,050 | $16,427 |
| 2017 | $6,120 | $26,457 | $8,050 | $18,407 |
| 2016 | $5,885 | $27,073 | $8,050 | $19,023 |
| 2015 | $5,643 | $22,730 | $6,650 | $16,080 |
| 2014 | $5,681 | $23,256 | $6,650 | $16,606 |
| 2013 | -- | $23,256 | $6,650 | $16,606 |
Source: Public Records
Map
Nearby Homes
- 407 Sunset Dr
- 319 Kilpatrick Ave
- 414 Skokie Ct
- 4710 Russett Ln Unit R1
- 4710 Russett Ln Unit R201
- 10039 Lacrosse Ave
- 10124 Peach Pkwy Unit N208
- 408 Beverly Dr
- 10081 Frontage Rd
- 226 Briar Dr
- 10077 Frontage Rd Unit F
- 2536 Old Glenview Rd
- 10055 Frontage Rd Unit F
- 3004 Highland Ave
- 118 Lockerbie Ln
- 3227 Greenleaf Ave
- 637 Hibbard Rd
- 3306 Wilmette Ave
- 29 Dale St
- 725 Locust Rd