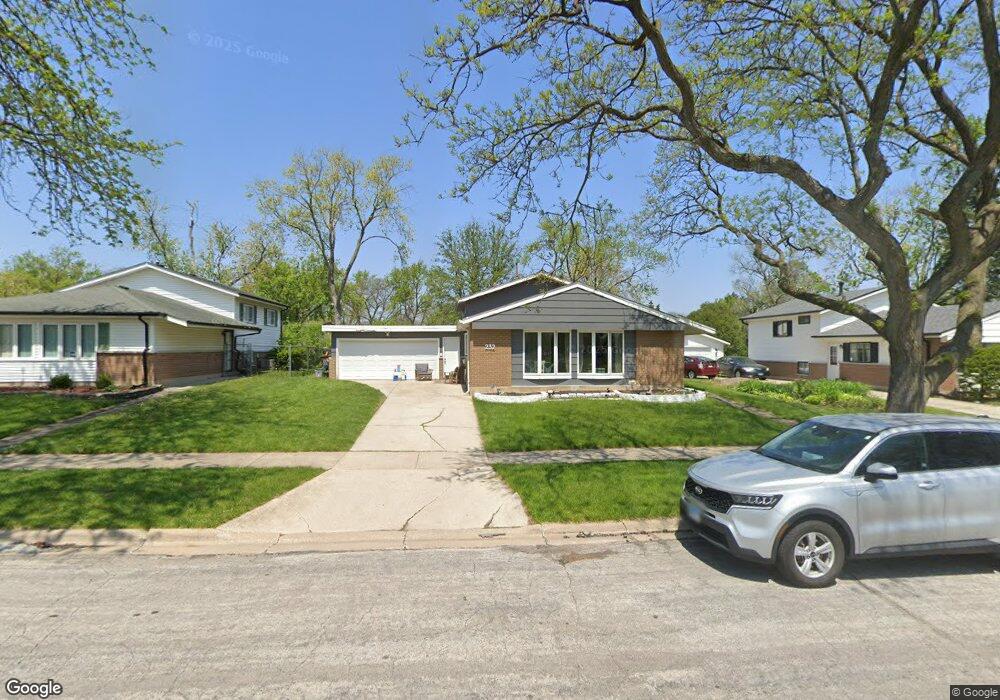
232 Thomas St Park Forest, IL 60466
Estimated Value: $182,248 - $212,000
3
Beds
2
Baths
1,224
Sq Ft
$166/Sq Ft
Est. Value
About This Home
This home is located at 232 Thomas St, Park Forest, IL 60466 and is currently estimated at $203,312, approximately $166 per square foot. 232 Thomas St is a home located in Cook County with nearby schools including Illinois School, Indiana Elementary School, and Arcadia Elementary School.
Ownership History
Date
Name
Owned For
Owner Type
Purchase Details
Closed on
Jan 18, 2010
Sold by
Stock Ada O
Bought by
Walls Earnest and Walls Jolly
Current Estimated Value
Home Financials for this Owner
Home Financials are based on the most recent Mortgage that was taken out on this home.
Original Mortgage
$97,697
Interest Rate
5.5%
Mortgage Type
FHA
Purchase Details
Closed on
Jul 31, 2008
Sold by
Stock Ada O
Bought by
Stock Ada O and Ada O Stock Trust
Purchase Details
Closed on
Aug 6, 2006
Sold by
Stock Werner and Stock Ada O
Bought by
Stock Werner and Stock Ada O
Create a Home Valuation Report for This Property
The Home Valuation Report is an in-depth analysis detailing your home's value as well as a comparison with similar homes in the area
Home Values in the Area
Average Home Value in this Area
Purchase History
| Date | Buyer | Sale Price | Title Company |
|---|---|---|---|
| Walls Earnest | $99,500 | Git | |
| Stock Ada O | -- | None Available | |
| Stock Werner | -- | None Available |
Source: Public Records
Mortgage History
| Date | Status | Borrower | Loan Amount |
|---|---|---|---|
| Previous Owner | Walls Earnest | $97,697 |
Source: Public Records
Tax History
| Year | Tax Paid | Tax Assessment Tax Assessment Total Assessment is a certain percentage of the fair market value that is determined by local assessors to be the total taxable value of land and additions on the property. | Land | Improvement |
|---|---|---|---|---|
| 2025 | $7,166 | $16,000 | $3,024 | $12,976 |
| 2024 | $7,166 | $16,000 | $3,024 | $12,976 |
| 2023 | $3,545 | $16,000 | $3,024 | $12,976 |
| 2022 | $3,545 | $8,506 | $2,646 | $5,860 |
| 2021 | $3,682 | $8,506 | $2,646 | $5,860 |
| 2020 | $3,673 | $8,506 | $2,646 | $5,860 |
| 2019 | $3,912 | $9,501 | $2,457 | $7,044 |
| 2018 | $3,804 | $9,501 | $2,457 | $7,044 |
| 2017 | $3,773 | $9,501 | $2,457 | $7,044 |
| 2016 | $5,255 | $8,855 | $2,268 | $6,587 |
| 2015 | $3,520 | $8,855 | $2,268 | $6,587 |
| 2014 | $3,476 | $8,855 | $2,268 | $6,587 |
| 2013 | $3,203 | $9,098 | $2,268 | $6,830 |
Source: Public Records
Map
Nearby Homes
Your Personal Tour Guide
Ask me questions while you tour the home.