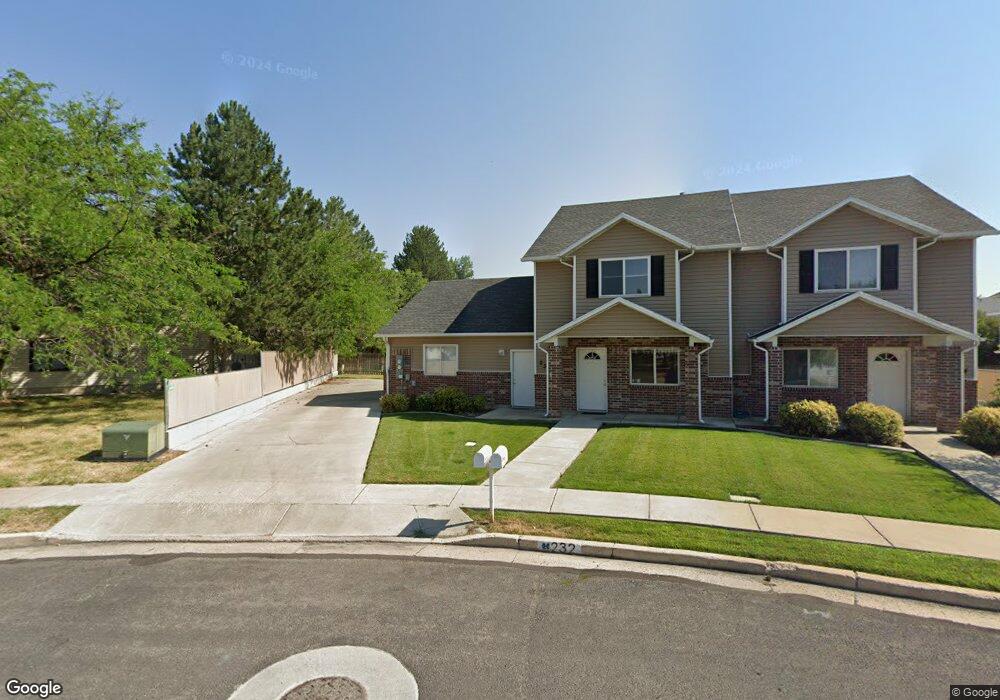
232 W 1140 N Logan, UT 84341
Bridger NeighborhoodEstimated Value: $401,000 - $509,000
4
Beds
4
Baths
2,800
Sq Ft
$168/Sq Ft
Est. Value
About This Home
This home is located at 232 W 1140 N, Logan, UT 84341 and is currently estimated at $470,692, approximately $168 per square foot. 232 W 1140 N is a home located in Cache County with nearby schools including Bridger School, Mount Logan Middle School, and Logan High School.
Ownership History
Date
Name
Owned For
Owner Type
Purchase Details
Closed on
Oct 12, 2018
Sold by
C & S Properties Of Kamas Llc
Bought by
Tyrach Utah Llc
Current Estimated Value
Purchase Details
Closed on
Jun 1, 2016
Sold by
Page Clinton and Page Shanna
Bought by
C & S Properties Of Kamas Llc
Purchase Details
Closed on
May 31, 2016
Sold by
Thompson Jared R
Bought by
Page Clinton and Page Shanna
Purchase Details
Closed on
Jun 30, 2011
Sold by
Thompson Jared and Thompson Brooke
Bought by
J & B Thompson Properties Llc
Purchase Details
Closed on
May 24, 2006
Sold by
Thompson Jared
Bought by
Thompson Jared and Thompson Brooke
Home Financials for this Owner
Home Financials are based on the most recent Mortgage that was taken out on this home.
Original Mortgage
$145,000
Interest Rate
6.5%
Mortgage Type
New Conventional
Purchase Details
Closed on
Jan 25, 2005
Sold by
Worthen Dennis M and Worthen Ruth
Bought by
Thompson Jared
Create a Home Valuation Report for This Property
The Home Valuation Report is an in-depth analysis detailing your home's value as well as a comparison with similar homes in the area
Home Values in the Area
Average Home Value in this Area
Purchase History
| Date | Buyer | Sale Price | Title Company |
|---|---|---|---|
| Tyrach Utah Llc | -- | Cache Title Company Inc | |
| C & S Properties Of Kamas Llc | -- | Hickman Land Title | |
| Page Clinton | -- | Hickman Land Title Company | |
| Thompson Jared R | -- | Hickman Land Title Company | |
| J & B Thompson Properties Llc | -- | None Available | |
| Thompson Jared | -- | Advanced Title | |
| Thompson Jared | -- | Hickman Land Title Company |
Source: Public Records
Mortgage History
| Date | Status | Borrower | Loan Amount |
|---|---|---|---|
| Previous Owner | Thompson Jared | $145,000 |
Source: Public Records
Tax History Compared to Growth
Tax History
| Year | Tax Paid | Tax Assessment Tax Assessment Total Assessment is a certain percentage of the fair market value that is determined by local assessors to be the total taxable value of land and additions on the property. | Land | Improvement |
|---|---|---|---|---|
| 2025 | $1,882 | $442,450 | $158,100 | $284,350 |
| 2024 | $1,943 | $442,450 | $158,100 | $284,350 |
| 2023 | $2,024 | $439,350 | $155,000 | $284,350 |
| 2022 | $2,069 | $419,350 | $135,000 | $284,350 |
| 2021 | $2,139 | $368,500 | $110,000 | $258,500 |
| 2020 | $1,834 | $284,400 | $75,000 | $209,400 |
| 2019 | $1,917 | $284,400 | $75,000 | $209,400 |
| 2018 | $1,846 | $250,030 | $55,000 | $195,030 |
| 2017 | $1,669 | $119,515 | $0 | $0 |
| 2016 | $1,731 | $119,515 | $0 | $0 |
| 2015 | $1,732 | $119,515 | $0 | $0 |
| 2014 | $1,566 | $119,515 | $0 | $0 |
| 2013 | -- | $118,800 | $0 | $0 |
Source: Public Records
Map
Nearby Homes
- 1132 N 230 W
- 251 W 1100 N
- 1090 N 250 W
- 248 W 1140 N
- 241 W 1140 N
- 255 W 1100 N Unit 1
- 255 W 1100 N
- 243 W 1140 N
- 1146 N 230 W
- 1149 N 230 W
- 267 W 1100 N Unit 3
- 267 W 1100 N
- 255 W 1140 N
- 1153 N 230 W
- 261 W 1140 N
- 1079 N 200 W Unit 4
- 1079 N 200 W
- 1079 N 200 W Unit 5
- 1079 N 200 W Unit 3
- 1079 N 200 W Unit 4