Estimated Value: $426,000 - $449,823
4
Beds
2
Baths
2,092
Sq Ft
$211/Sq Ft
Est. Value
About This Home
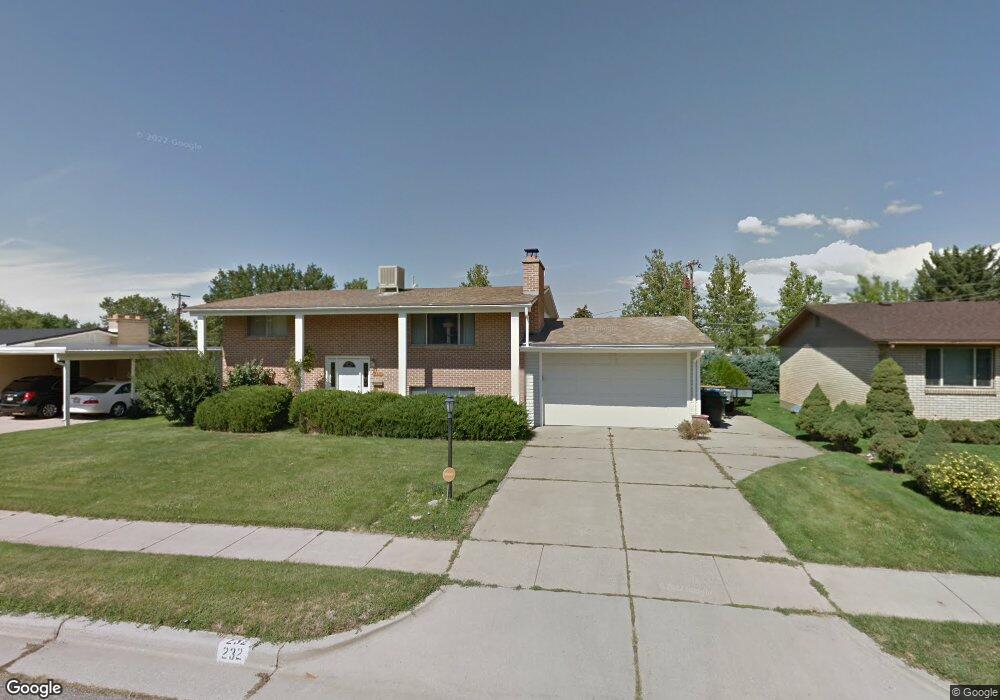
This home is located at 232 W 5250 S, Ogden, UT 84405 and is currently estimated at $441,206, approximately $210 per square foot. 232 W 5250 S is a home located in Weber County with nearby schools including Roosevelt School, T.H. Bell Junior High School, and Bonneville High School.
Ownership History
Date
Name
Owned For
Owner Type
Purchase Details
Closed on
Apr 9, 2026
Sold by
Alison Beardall
Bought by
Cockream Matthew
Current Estimated Value
Home Financials for this Owner
Home Financials are based on the most recent Mortgage that was taken out on this home.
Original Mortgage
$441,849
Outstanding Balance
$441,407
Interest Rate
5.98%
Mortgage Type
FHA
Estimated Equity
-$201
Purchase Details
Closed on
Nov 13, 2017
Sold by
Shelton Robert Scott and Dart Stacy
Bought by
Mortenson Sheldon J and Mortenson Amy D
Home Financials for this Owner
Home Financials are based on the most recent Mortgage that was taken out on this home.
Original Mortgage
$197,359
Interest Rate
4.37%
Mortgage Type
FHA
Purchase Details
Closed on
Oct 5, 2001
Sold by
Shelton R Pearce and Shelton Nancy I
Bought by
Shelton Nancy I and Pearce Shelton R
Create a Home Valuation Report for This Property
The Home Valuation Report is an in-depth analysis detailing your home's value as well as a comparison with similar homes in the area
Home Values in the Area
Average Home Value in this Area
Purchase History
We collect this data history from publicly available records. To have your information removed, we recommend requesting removal directly through your county’s website.
| Date | Buyer | Sale Price | Title Company |
|---|---|---|---|
| Cockream Matthew | -- | Verus Title Utah | |
| Mortenson Sheldon J | -- | Us Title Insurance Agency | |
| Shelton Nancy I | -- | -- |
Source: Public Records
Mortgage History
We collect this data history from publicly available records. To have your information removed, we recommend requesting removal directly through your county’s website.
| Date | Status | Borrower | Loan Amount |
|---|---|---|---|
| Open | Cockream Matthew | $441,849 | |
| Previous Owner | Mortenson Sheldon J | $197,359 |
Source: Public Records
Tax History
| Year | Tax Paid | Tax Assessment Tax Assessment Total Assessment is a certain percentage of the fair market value that is determined by local assessors to be the total taxable value of land and additions on the property. | Land | Improvement |
|---|---|---|---|---|
| 2025 | $2,548 | $405,310 | $130,008 | $275,302 |
| 2024 | $2,435 | $217,799 | $71,504 | $146,295 |
| 2023 | $2,345 | $209,550 | $71,476 | $138,074 |
| 2022 | $2,520 | $232,100 | $68,752 | $163,348 |
| 2021 | $1,952 | $295,000 | $65,010 | $229,990 |
| 2020 | $1,802 | $249,000 | $55,016 | $193,984 |
| 2019 | $1,689 | $218,000 | $49,894 | $168,106 |
| 2018 | $1,447 | $184,000 | $49,894 | $134,106 |
| 2017 | $1,223 | $147,000 | $41,032 | $105,968 |
| 2016 | $1,193 | $79,504 | $20,749 | $58,755 |
| 2015 | $1,211 | $79,504 | $20,749 | $58,755 |
| 2014 | $928 | $59,574 | $20,749 | $38,825 |
Source: Public Records
Map
Nearby Homes
Your Personal Tour Guide
Ask me questions while you tour the home.