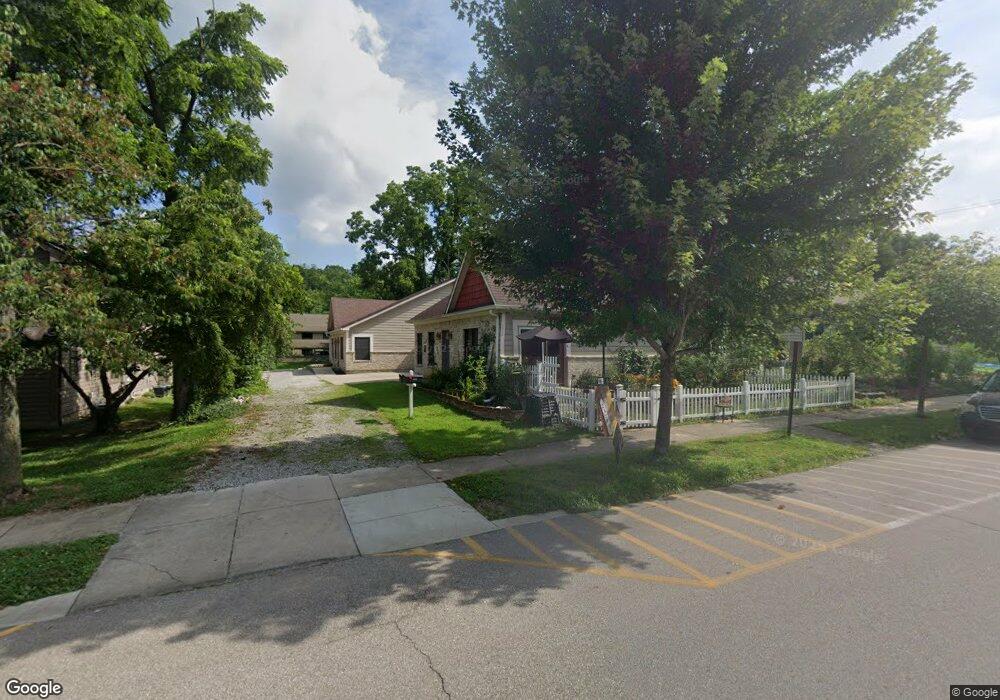
232 W Main St Nashville, IN 47448
Estimated Value: $258,000 - $300,000
2
Beds
2
Baths
2,400
Sq Ft
$120/Sq Ft
Est. Value
About This Home
This home is located at 232 W Main St, Nashville, IN 47448 and is currently estimated at $287,564, approximately $119 per square foot. 232 W Main St is a home located in Brown County with nearby schools including Brown County High School.
Ownership History
Date
Name
Owned For
Owner Type
Purchase Details
Closed on
Dec 23, 2020
Sold by
Rosenberry James B and Rosenerry Kathy L
Bought by
Bemenderfer Diana L
Current Estimated Value
Home Financials for this Owner
Home Financials are based on the most recent Mortgage that was taken out on this home.
Original Mortgage
$176,000
Outstanding Balance
$156,692
Interest Rate
2.7%
Mortgage Type
Stand Alone Refi Refinance Of Original Loan
Estimated Equity
$130,872
Purchase Details
Closed on
Mar 30, 2017
Sold by
David A Coffee - Executive Vp
Bought by
Member James Rumell -
Purchase Details
Closed on
Feb 9, 2017
Sold by
Southerland Scott D
Bought by
Coffey Evp David A
Purchase Details
Closed on
Jun 18, 2009
Sold by
Smi Indy Inc
Bought by
Rcs Holdings V Llc
Home Financials for this Owner
Home Financials are based on the most recent Mortgage that was taken out on this home.
Original Mortgage
$551,250
Interest Rate
4.86%
Create a Home Valuation Report for This Property
The Home Valuation Report is an in-depth analysis detailing your home's value as well as a comparison with similar homes in the area
Home Values in the Area
Average Home Value in this Area
Purchase History
| Date | Buyer | Sale Price | Title Company |
|---|---|---|---|
| Bemenderfer Diana L | -- | None Available | |
| Member James Rumell - | $71,600 | -- | |
| Rumbritt Llc | $71,600 | Franklin Title Insurance | |
| Coffey Evp David A | $197,500 | -- | |
| Rcs Holdings V Llc | -- | -- |
Source: Public Records
Mortgage History
| Date | Status | Borrower | Loan Amount |
|---|---|---|---|
| Open | Bemenderfer Diana L | $176,000 | |
| Previous Owner | Rcs Holdings V Llc | $551,250 |
Source: Public Records
Tax History Compared to Growth
Tax History
| Year | Tax Paid | Tax Assessment Tax Assessment Total Assessment is a certain percentage of the fair market value that is determined by local assessors to be the total taxable value of land and additions on the property. | Land | Improvement |
|---|---|---|---|---|
| 2024 | $1,020 | $283,300 | $43,000 | $240,300 |
| 2023 | $1,084 | $281,600 | $38,500 | $243,100 |
| 2022 | $1,094 | $253,500 | $38,500 | $215,000 |
| 2021 | $857 | $198,700 | $28,300 | $170,400 |
| 2020 | $716 | $191,900 | $28,300 | $163,600 |
| 2019 | $730 | $196,200 | $28,300 | $167,900 |
| 2018 | $3,221 | $209,700 | $28,300 | $181,400 |
| 2017 | $3,340 | $213,900 | $28,300 | $185,600 |
| 2016 | $3,275 | $215,800 | $28,300 | $187,500 |
| 2014 | $2,946 | $217,500 | $28,300 | $189,200 |
| 2013 | $2,946 | $213,500 | $28,300 | $185,200 |
Source: Public Records
Map
Nearby Homes
- 280 W Main St Unit E20
- 280 W Main St Unit B8
- 0 N State Road 135 Unit MBR21954355
- TBD N Van Buren St
- X State Road 46
- 0 State Road 46 E Unit MBR22058440
- 0 State Road 46 Unit 11501975
- 00 N State Road 135
- 0 Redbud Dr
- 424 Wells Dr
- 576 State Road 135 N
- 972 Helmsburg Rd
- 585 Artist Dr
- 0 Oak Run Dr Unit MBR22017862
- 123 Ridgeway Dr
- 149 W Hilltop Ln
- 00 Pine Water Ct
- 75 Pine Water Ct
- 1335 Greasy Creek Rd
- 4600 Old State Road 46
- 232 W Main St
- 232, Unit B W Main St
- 232 A W Main St
- 232 W Main St Unit A&B
- 232 W Main St Unit B
- 232 W Main St
- 232 W Main St Unit A
- 232 W Main St Unit 1
- 232 W Main St
- 232 W Main St
- 232 B W Main St
- 222 W Main St
- 20 N Sycamore Ln
- 20 N Sycamore Ln Unit 4
- 20 N Sycamore Ln
- 30 N Sycamore Ln
- 30 N Sycamore Ln
- 30 N Sycamore Ln Unit A
- 30 N Sycamore Ln Unit B
- 30 N Sycamore Ln Unit 2