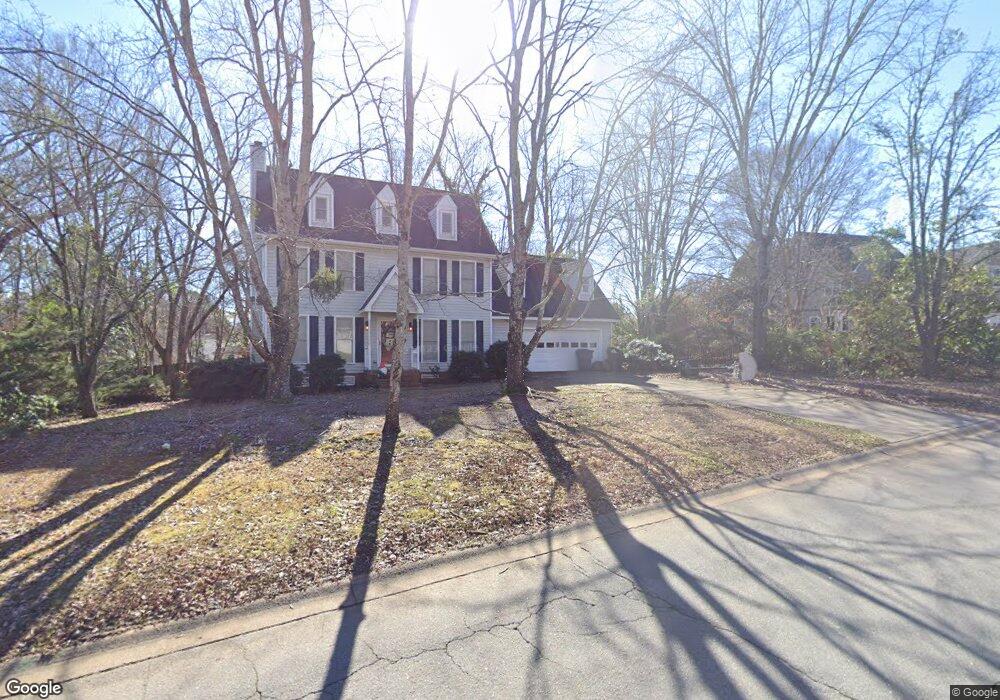
232 Whiteford Way Lexington, SC 29072
Estimated Value: $287,272 - $330,000
4
Beds
3
Baths
1,848
Sq Ft
$164/Sq Ft
Est. Value
About This Home
This home is located at 232 Whiteford Way, Lexington, SC 29072 and is currently estimated at $303,068, approximately $163 per square foot. 232 Whiteford Way is a home located in Lexington County with nearby schools including Midway Elementary School, River Bluff High School, and American Leadership Academy South Carolina-Lexington Campus.
Ownership History
Date
Name
Owned For
Owner Type
Purchase Details
Closed on
Sep 27, 2024
Sold by
Dubois Amy E and Jeffus Amy E
Bought by
Broadway Kimberly and Martin Kensington
Current Estimated Value
Purchase Details
Closed on
Jun 9, 2006
Sold by
Laney Alan N and Laney Carla F
Bought by
Dubois David A and Jeffus Amy E
Home Financials for this Owner
Home Financials are based on the most recent Mortgage that was taken out on this home.
Original Mortgage
$134,400
Interest Rate
6.5%
Mortgage Type
New Conventional
Purchase Details
Closed on
May 3, 2005
Sold by
Coker Mark Colin and Coker Heather Reynolds
Bought by
Laney Alan N and Laney Carla F
Home Financials for this Owner
Home Financials are based on the most recent Mortgage that was taken out on this home.
Original Mortgage
$168,000
Interest Rate
5.99%
Mortgage Type
New Conventional
Purchase Details
Closed on
Mar 31, 1998
Sold by
Seymour Kenneth W
Bought by
Coker Mark C
Create a Home Valuation Report for This Property
The Home Valuation Report is an in-depth analysis detailing your home's value as well as a comparison with similar homes in the area
Home Values in the Area
Average Home Value in this Area
Purchase History
| Date | Buyer | Sale Price | Title Company |
|---|---|---|---|
| Broadway Kimberly | $280,000 | None Listed On Document | |
| Dubois David A | $168,000 | None Available | |
| Laney Alan N | $168,000 | -- | |
| Coker Mark C | $135,000 | -- |
Source: Public Records
Mortgage History
| Date | Status | Borrower | Loan Amount |
|---|---|---|---|
| Previous Owner | Dubois David A | $134,400 | |
| Previous Owner | Laney Alan N | $168,000 |
Source: Public Records
Tax History Compared to Growth
Tax History
| Year | Tax Paid | Tax Assessment Tax Assessment Total Assessment is a certain percentage of the fair market value that is determined by local assessors to be the total taxable value of land and additions on the property. | Land | Improvement |
|---|---|---|---|---|
| 2024 | $4,755 | $9,592 | $2,357 | $7,235 |
| 2023 | $4,755 | $9,592 | $2,357 | $7,235 |
| 2022 | $4,573 | $9,592 | $2,357 | $7,235 |
| 2020 | $4,599 | $9,592 | $2,357 | $7,235 |
| 2019 | $4,136 | $8,340 | $1,800 | $6,540 |
| 2018 | $4,106 | $8,340 | $1,800 | $6,540 |
| 2017 | $4,038 | $8,340 | $1,800 | $6,540 |
| 2016 | $3,912 | $8,340 | $1,800 | $6,540 |
| 2014 | $4,297 | $9,882 | $1,860 | $8,022 |
| 2013 | -- | $9,880 | $1,860 | $8,020 |
Source: Public Records
Map
Nearby Homes
- 113 Silverstone Rd
- 109 Armanda Rd
- 305 Saddlebrooke Rd
- 712 Bentley Dr
- 143 Holly Leaf Ln
- 414 Craftsman Ct
- 109 Timberline Ct
- 488 Forest Edge Trail
- 154 Pilgrim Church Rd
- 481 Forest Edge Trail
- 476 Forest Edge Trail
- 2440 Thode Ln
- 108 Hunters Ridge Dr
- 112 Plymouth Pass Dr
- 1442 Trailhead Ln
- 441 Forest Edge Trail
- 568 Charles Ct
- 1423 Trailhead Ln
- 43 Boardwalk Ln
- 312 Settlers Trail
- 236 Whiteford Way
- 228 Whiteford Way
- 205 Tarrington Cir
- 203 Tarrington Cir
- 203 Tarrington Cir Unit 49
- 209 Tarrington Cir
- 105 Silverstone Rd
- 240 Whiteford Way
- 237 Whiteford Way
- 233 Whiteford Way
- 241 Whiteford Way
- 229 Whiteford Way
- 245 Whiteford Way
- 300 Whiteford Way
- 100 Silverstone Rd
- 208 Tarrington Cir
- 217 Tarrington Cir
- 308 Whiteford Way
- 104 Silverstone Rd
- 249 Whiteford Way