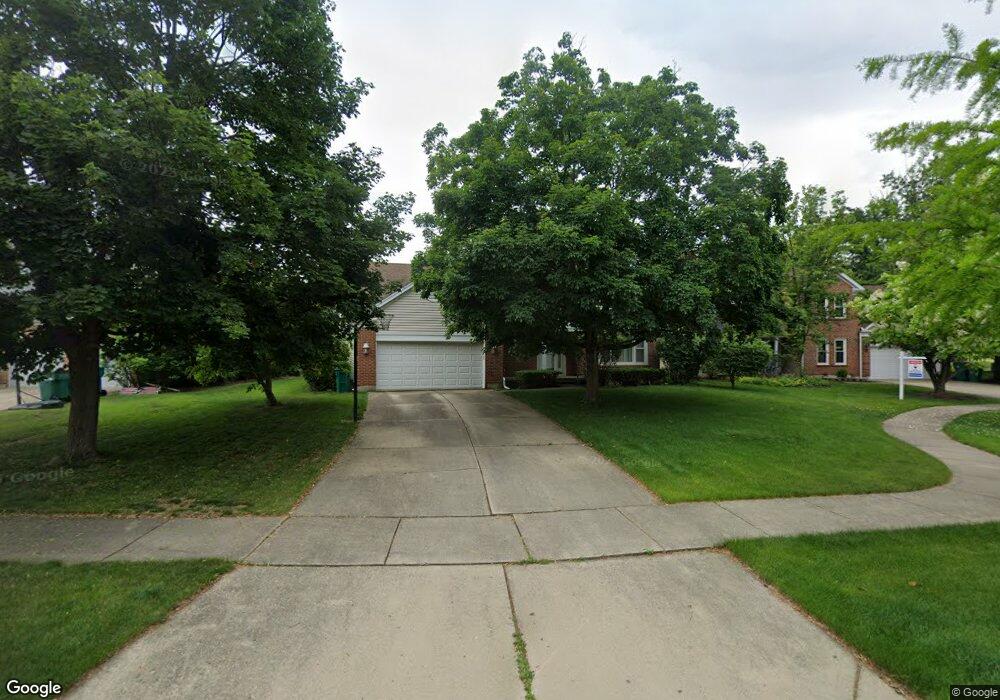
2320 Acorn Place Buffalo Grove, IL 60089
The Woodlands of Fiore NeighborhoodEstimated Value: $587,000 - $700,000
4
Beds
4
Baths
2,130
Sq Ft
$312/Sq Ft
Est. Value
About This Home
This home is located at 2320 Acorn Place, Buffalo Grove, IL 60089 and is currently estimated at $663,658, approximately $311 per square foot. 2320 Acorn Place is a home located in Lake County with nearby schools including Meridian Middle School, Earl Pritchett School, and Aptakisic Junior High School.
Ownership History
Date
Name
Owned For
Owner Type
Purchase Details
Closed on
Jan 16, 2007
Sold by
Berkowitz Paul and Berkowitz Margo
Bought by
Zhang Xu Feng and Luo Li Jie
Current Estimated Value
Home Financials for this Owner
Home Financials are based on the most recent Mortgage that was taken out on this home.
Original Mortgage
$360,000
Outstanding Balance
$215,255
Interest Rate
6.22%
Mortgage Type
Purchase Money Mortgage
Estimated Equity
$448,403
Purchase Details
Closed on
Jul 10, 2001
Sold by
Goldman Jeffrey E and Goldman Staci A
Bought by
Berkowitz Paul and Berkowitz Margo
Home Financials for this Owner
Home Financials are based on the most recent Mortgage that was taken out on this home.
Original Mortgage
$328,500
Interest Rate
7.14%
Purchase Details
Closed on
Jan 30, 1999
Sold by
Shaffer John M and Shaffer Sally D
Bought by
Goldman Jeffrey E and Goldman Staci A
Home Financials for this Owner
Home Financials are based on the most recent Mortgage that was taken out on this home.
Original Mortgage
$240,000
Interest Rate
6.88%
Create a Home Valuation Report for This Property
The Home Valuation Report is an in-depth analysis detailing your home's value as well as a comparison with similar homes in the area
Home Values in the Area
Average Home Value in this Area
Purchase History
| Date | Buyer | Sale Price | Title Company |
|---|---|---|---|
| Zhang Xu Feng | $460,000 | Multiple | |
| Berkowitz Paul | $365,000 | -- | |
| Goldman Jeffrey E | $305,000 | Chicago Title Insurance Co |
Source: Public Records
Mortgage History
| Date | Status | Borrower | Loan Amount |
|---|---|---|---|
| Open | Zhang Xu Feng | $360,000 | |
| Previous Owner | Berkowitz Paul | $328,500 | |
| Previous Owner | Goldman Jeffrey E | $240,000 |
Source: Public Records
Tax History Compared to Growth
Tax History
| Year | Tax Paid | Tax Assessment Tax Assessment Total Assessment is a certain percentage of the fair market value that is determined by local assessors to be the total taxable value of land and additions on the property. | Land | Improvement |
|---|---|---|---|---|
| 2024 | $15,105 | $163,904 | $47,070 | $116,834 |
| 2023 | $14,465 | $154,656 | $44,414 | $110,242 |
| 2022 | $14,465 | $154,055 | $44,241 | $109,814 |
| 2021 | $14,411 | $157,202 | $43,764 | $113,438 |
| 2020 | $14,129 | $157,738 | $43,913 | $113,825 |
| 2019 | $13,755 | $157,156 | $43,751 | $113,405 |
| 2018 | $7,207 | $160,613 | $47,560 | $113,053 |
| 2017 | $13,914 | $156,864 | $46,450 | $110,414 |
| 2016 | $13,433 | $150,210 | $44,480 | $105,730 |
| 2015 | $13,171 | $140,475 | $41,597 | $98,878 |
| 2014 | $12,124 | $128,396 | $44,675 | $83,721 |
| 2012 | $12,660 | $138,319 | $44,765 | $93,554 |
Source: Public Records
Map
Nearby Homes
- 259 Willow Pkwy Unit 403
- 10 Chestnut Ct E
- 61 Willow Pkwy Unit 731
- 361 Willow Pkwy Unit 234
- 333 Didier Ct
- 5 Willow Pkwy Unit 892
- 2071 Wright Blvd
- 2033 Olive Hill Dr
- 4 Daybreak Terrace
- 361 Hoffmann Dr
- 22825 N Prairie Rd
- 268 Hoffmann Dr
- 486 Satinwood Terrace Unit 11
- 16637 W Brockman Ave
- 16639 W Brockman Ave
- 22118 N Prairie Rd
- 2861 Whispering Oaks Dr
- 1901 Brandywyn Ln
- 321 Foxford Dr
- 2770 Sandalwood Rd Unit 3
- 2318 Acorn Place
- 2314 Crab Apple Terrace
- 2312 Crab Apple Terrace
- 2316 Crab Apple Terrace
- 2324 Acorn Place
- 2334 Acorn Place
- 2332 Acorn Place
- 2336 Acorn Place Unit 4
- 2326 Acorn Place
- 2330 Acorn Place
- 2310 Crab Apple Terrace
- 2328 Acorn Place
- 63 Chestnut Terrace
- 65 Chestnut Terrace
- 68 Chestnut Terrace
- 2308 Crab Apple Terrace
- 2300 Crab Apple Terrace
- 2302 Crab Apple Terrace
- 69 Chestnut Terrace
- 66 Chestnut Terrace