A
Landlord's Agent in 2024
Angela Ordoyne
Scarlet Key Properties, LLC
(512) 948-2111
14 in this area
17 Total Sales
Estimated Value: $267,547 - $345,000
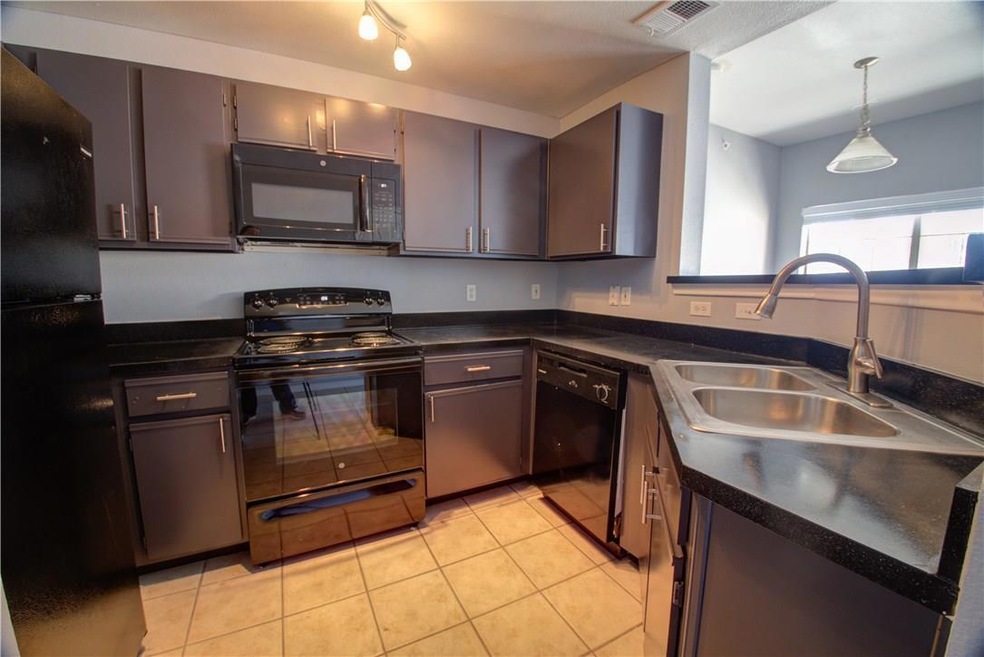
Gated condominium community with pool, package facility, and gym. Short driving distance to the domain, shopping and many restaurants. Resident responsible for water electric and renters insurance. $50 application fee per person paid online, ad $125 admin fee paid via Zelle. $250 pet fee and $250 per deposit, max of 2 up to 55 pounds. 1 year lease.
Last Agent to Rent the Property
Scarlet Key Properties, LLC Brokerage Phone: (512) 827-8088 License #0658605 Listed on: 08/08/2024
| Date | Buyer | Sale Price | Title Company |
|---|---|---|---|
| Downing Michael Edward | -- | Reliant Title Agency |
| Date | Status | Borrower | Loan Amount |
|---|---|---|---|
| Open | Downing Michael Edward | $246,653 |
| Date | Event | Price | List to Sale | Price per Sq Ft |
|---|---|---|---|---|
| 09/06/2024 09/06/24 | Rented | $1,695 | 0.0% | -- |
| 09/03/2024 09/03/24 | Under Contract | -- | -- | -- |
| 08/08/2024 08/08/24 | For Rent | $1,695 | +23.3% | -- |
| 01/29/2020 01/29/20 | Rented | $1,375 | 0.0% | -- |
| 01/16/2020 01/16/20 | For Rent | $1,375 | +1.9% | -- |
| 04/03/2019 04/03/19 | Rented | $1,350 | 0.0% | -- |
| 03/29/2019 03/29/19 | Under Contract | -- | -- | -- |
| 03/21/2019 03/21/19 | For Rent | $1,350 | +2.7% | -- |
| 02/19/2018 02/19/18 | Rented | $1,315 | 0.0% | -- |
| 02/10/2018 02/10/18 | Under Contract | -- | -- | -- |
| 01/11/2018 01/11/18 | For Rent | $1,315 | -- | -- |
| Year | Tax Paid | Tax Assessment Tax Assessment Total Assessment is a certain percentage of the fair market value that is determined by local assessors to be the total taxable value of land and additions on the property. | Land | Improvement |
|---|---|---|---|---|
| 2025 | $5,519 | $259,679 | $382 | $259,297 |
| 2023 | $5,841 | $322,861 | $382 | $322,479 |
| 2022 | $6,718 | $340,178 | $382 | $339,796 |
| 2021 | $5,408 | $248,462 | $382 | $248,080 |
| 2020 | $4,736 | $220,793 | $382 | $220,411 |
| 2018 | $3,946 | $178,228 | $382 | $177,846 |
| 2017 | $3,104 | $139,184 | $26,756 | $112,428 |
| 2016 | $2,826 | $126,723 | $26,756 | $99,967 |
| 2015 | $2,599 | $114,437 | $26,756 | $87,681 |
| 2014 | $2,599 | $112,050 | $26,756 | $85,294 |
A
Landlord's Agent in 2024
Angela Ordoyne
Scarlet Key Properties, LLC
(512) 948-2111
14 in this area
17 Total Sales
R
Tenant's Agent in 2024
Reggie Donaldson
Keller Williams Realty
(207) 440-3534
29 Total Sales
J
Buyer's Agent in 2020
Jennifer Snowden
Scarlet Key Properties, LLC
P
Buyer's Agent in 2019
Pamela Drawbaugh
Coldwell Banker Realty

Buyer's Agent in 2018
Rhianon Cote
Compass RE Texas, LLC
(512) 999-3151
42 Total Sales
Source: Unlock MLS (Austin Board of REALTORS®)
MLS Number: 8896349
APN: 740379
Disclaimer: Certain information contained herein is derived from information provided by parties other than Homes.com. All information provided is deemed reliable, but is not guaranteed to be accurate and should be independently verified.
![]() Based on information from the Austin Board of REALTORS® (alternatively, from ACTRIS). Neither the Board nor ACTRIS guarantees or is in any way responsible for its accuracy. All data is provided “AS IS” and with all faults. Data maintained by the Board or ACTRIS may not reflect all real estate activity in the market.
Based on information from the Austin Board of REALTORS® (alternatively, from ACTRIS). Neither the Board nor ACTRIS guarantees or is in any way responsible for its accuracy. All data is provided “AS IS” and with all faults. Data maintained by the Board or ACTRIS may not reflect all real estate activity in the market.
Information being provided is for consumers’ personal, non-commercial use and may not be used for any purpose other than to identify prospective properties consumers may be interested in purchasing.
The Digital Millennium Copyright Act of 1998, 17 U.S.C. § 512 (the “DMCA”) provides recourse for copyright owners who believe that material appearing on the Internet infringes their rights under U.S. copyright law. If you believe in good faith that any content or material made available in connection with our website or services infringes your copyright, you (or your agent) may send us a notice requesting that the content or material be removed, or access to it blocked.
Notices must be sent in writing by email to DMCAnotice@MLSGrid.com.
The DMCA requires that your notice of alleged copyright infringement include the following information:
(1) description of the copyrighted work that is the subject of claimed infringement;
(2) description of the alleged infringing content and information sufficient to permit us to locate the content;
(3) contact information for you, including your address, telephone number and email address;
(4) a statement by you that you have a good faith belief that the content in the manner complained of is not authorized by the copyright owner, or its agent, or by the operation of any law;
(5) a statement by you, signed under penalty of perjury, that the information in the notification is accurate and that you have the authority to enforce the copyrights that are claimed to be infringed; and
(6) a physical or electronic signature of the copyright owner or a person authorized to act on the copyright owner’s behalf. Failure to include all of the above information may result in the delay of the processing of your complaint.