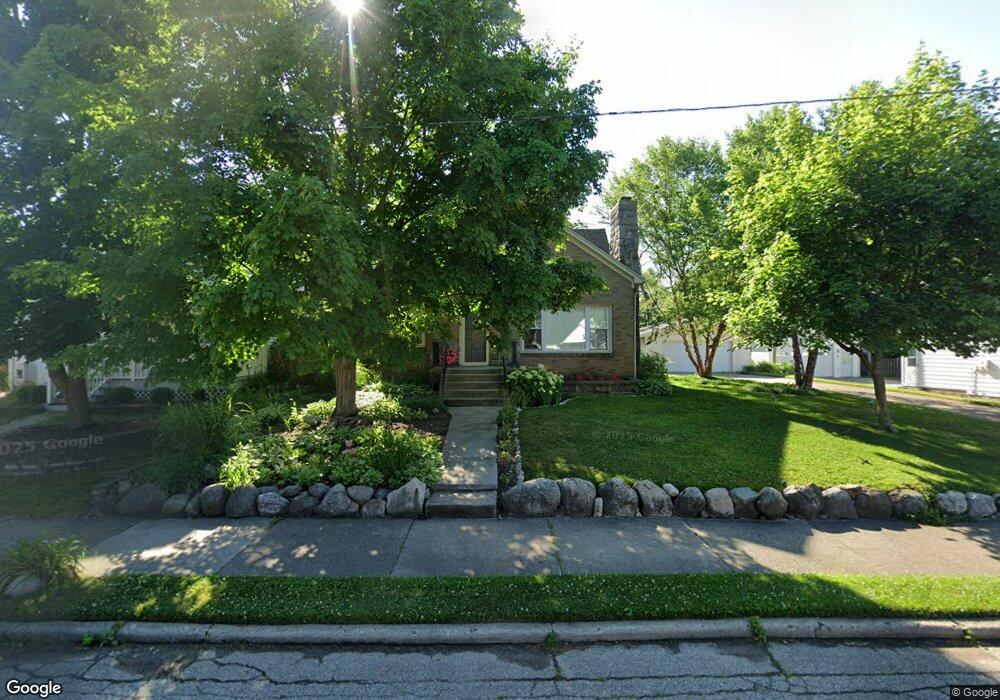
2320 Riverside Dr NE Grand Rapids, MI 49505
Creston NeighborhoodEstimated Value: $346,000 - $392,529
4
Beds
2
Baths
1,854
Sq Ft
$198/Sq Ft
Est. Value
About This Home
This home is located at 2320 Riverside Dr NE, Grand Rapids, MI 49505 and is currently estimated at $367,382, approximately $198 per square foot. 2320 Riverside Dr NE is a home located in Kent County with nearby schools including Riverside Middle School, Union High School, and ISJ Academy.
Ownership History
Date
Name
Owned For
Owner Type
Purchase Details
Closed on
Sep 26, 2003
Sold by
Bruinius Mark W and Bruinius Jessica Jones
Bought by
Deboer Peter E and Deboer Nancy L
Current Estimated Value
Home Financials for this Owner
Home Financials are based on the most recent Mortgage that was taken out on this home.
Original Mortgage
$116,400
Outstanding Balance
$55,360
Interest Rate
6.49%
Mortgage Type
Purchase Money Mortgage
Estimated Equity
$312,022
Purchase Details
Closed on
Mar 26, 1998
Sold by
Brn Brn M M and Brn Jns J
Bought by
Deboer Peter E Nancy L
Purchase Details
Closed on
Feb 20, 1997
Sold by
Bruinius Wldmn
Bought by
Bruinius and Bruinius Jones
Purchase Details
Closed on
Apr 15, 1996
Sold by
Dillon Dillon T T and Dillon Wildman T
Bought by
Deboer Wildman T and Deboer Peter E Nancy L
Purchase Details
Closed on
Jan 4, 1991
Sold by
Roodvoets Roodvoets F F and Roodvoets Dillon T
Bought by
Deboer Peter E Nancy L
Purchase Details
Closed on
Jan 3, 1991
Sold by
Chanski Chanski G G and Roodvoets Chanski
Bought by
Deboer Peter E Nancy L
Purchase Details
Closed on
Dec 8, 1983
Create a Home Valuation Report for This Property
The Home Valuation Report is an in-depth analysis detailing your home's value as well as a comparison with similar homes in the area
Home Values in the Area
Average Home Value in this Area
Purchase History
| Date | Buyer | Sale Price | Title Company |
|---|---|---|---|
| Deboer Peter E | $145,500 | Chicago Title | |
| Deboer Peter E Nancy L | -- | -- | |
| Bruinius | $102,000 | -- | |
| Deboer Wildman T | $102,000 | -- | |
| Deboer Peter E Nancy L | $79,500 | -- | |
| Deboer Peter E Nancy L | $56,900 | -- | |
| -- | $56,900 | -- |
Source: Public Records
Mortgage History
| Date | Status | Borrower | Loan Amount |
|---|---|---|---|
| Open | Deboer Peter E | $116,400 |
Source: Public Records
Tax History Compared to Growth
Tax History
| Year | Tax Paid | Tax Assessment Tax Assessment Total Assessment is a certain percentage of the fair market value that is determined by local assessors to be the total taxable value of land and additions on the property. | Land | Improvement |
|---|---|---|---|---|
| 2025 | $2,369 | $199,000 | $0 | $0 |
| 2024 | $2,369 | $183,000 | $0 | $0 |
| 2023 | $2,510 | $156,000 | $0 | $0 |
| 2022 | $140 | $127,000 | $0 | $0 |
| 2021 | $136 | $125,300 | $0 | $0 |
| 2020 | $2,227 | $116,200 | $0 | $0 |
| 2019 | $2,332 | $110,400 | $0 | $0 |
| 2018 | $2,252 | $101,800 | $0 | $0 |
| 2017 | $2,193 | $88,300 | $0 | $0 |
| 2016 | $2,219 | $82,400 | $0 | $0 |
| 2015 | $2,064 | $82,400 | $0 | $0 |
| 2013 | -- | $60,700 | $0 | $0 |
Source: Public Records
Map
Nearby Homes
- 122 Bowne St NE
- 68 Bowne St NE
- 16 Graceland St NE
- 240 Eleanor St NE
- 2060 Swensberg Ave NE
- 2107 Prospect Ave NE
- 2480 Lafayette Ave NE
- 2624 Monroe Ave NE
- 22 Elmwood St NE
- 1922 Coit Ave NE
- 225 Burr Oak St NE
- 465 Kenwood St NE
- 142 Burr Oak St NE
- 143 Dean St NE
- 483 Kenwood St NE
- 2630 Oakwood Ave NE
- 155 Palmer St NE
- 518 Russwood St NE
- 30 Palmer St NW
- 2033 Melita Ave NE
- 2324 Riverside Dr NE
- 108 Conrad St NE
- 2308 Riverside Dr NE
- 104 Conrad St NE
- 2304 Riverside Dr NE
- 119 Lawrence St NE
- 120 Conrad St NE
- 2300 Riverside Dr NE
- 2319 Riverside Dr NE
- 2325 Riverside Dr NE
- 2315 Riverside Dr NE
- 2309 Riverside Dr NE
- 2329 Riverside Dr NE
- 124 Conrad St NE
- 2256 Riverside Dr NE
- 123 Lawrence St NE
- 107 Conrad St NE
- 2336 Riverside Dr NE Unit 38
- 2336 Riverside Dr NE Unit 2338
- 2305 Riverside Dr NE