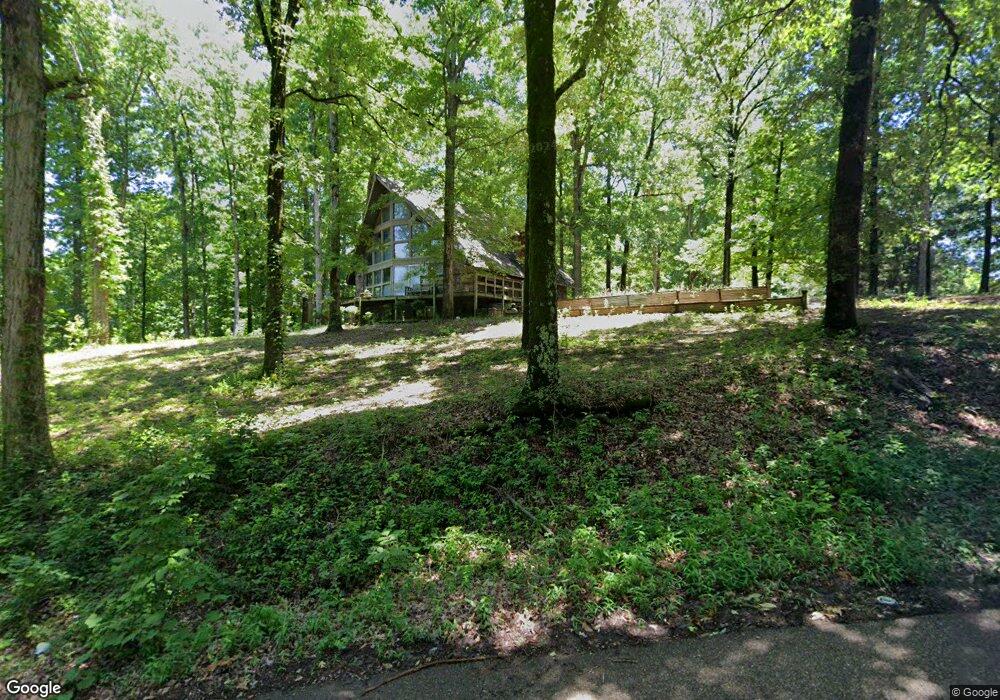
2320 Sfc 340 Forrest City, AR 72335
Estimated Value: $111,077 - $151,000
--
Bed
2
Baths
1,904
Sq Ft
$71/Sq Ft
Est. Value
About This Home
This home is located at 2320 Sfc 340, Forrest City, AR 72335 and is currently estimated at $136,019, approximately $71 per square foot. 2320 Sfc 340 is a home located in St. Francis County with nearby schools including Central Elementary School, Stewart Elementary School, and Forrest City Junior High School.
Ownership History
Date
Name
Owned For
Owner Type
Purchase Details
Closed on
Dec 5, 2012
Bought by
Burns Michael R and Burns Cynthia M
Current Estimated Value
Purchase Details
Closed on
Oct 14, 2005
Sold by
Morocco James and Morocco Ann
Bought by
Riggs Owen M
Home Financials for this Owner
Home Financials are based on the most recent Mortgage that was taken out on this home.
Original Mortgage
$112,208
Interest Rate
5.73%
Mortgage Type
FHA
Purchase Details
Closed on
Jul 1, 1986
Bought by
Sands
Create a Home Valuation Report for This Property
The Home Valuation Report is an in-depth analysis detailing your home's value as well as a comparison with similar homes in the area
Home Values in the Area
Average Home Value in this Area
Purchase History
| Date | Buyer | Sale Price | Title Company |
|---|---|---|---|
| Burns Michael R | $115,000 | -- | |
| Riggs Owen M | $114,000 | -- | |
| Sands | $18,000 | -- |
Source: Public Records
Mortgage History
| Date | Status | Borrower | Loan Amount |
|---|---|---|---|
| Previous Owner | Sands | $112,208 |
Source: Public Records
Tax History Compared to Growth
Tax History
| Year | Tax Paid | Tax Assessment Tax Assessment Total Assessment is a certain percentage of the fair market value that is determined by local assessors to be the total taxable value of land and additions on the property. | Land | Improvement |
|---|---|---|---|---|
| 2024 | $672 | $15,370 | $1,450 | $13,920 |
| 2023 | $656 | $15,370 | $1,450 | $13,920 |
| 2022 | $282 | $15,370 | $1,450 | $13,920 |
| 2021 | $266 | $15,000 | $1,450 | $13,550 |
| 2020 | $266 | $15,000 | $1,450 | $13,550 |
| 2019 | $281 | $15,000 | $1,450 | $13,550 |
| 2018 | $306 | $15,000 | $1,450 | $13,550 |
| 2017 | $656 | $15,000 | $1,450 | $13,550 |
| 2016 | $1,033 | $23,630 | $1,450 | $22,180 |
| 2015 | $1,033 | $23,630 | $1,450 | $22,180 |
| 2014 | $1,033 | $23,630 | $1,450 | $22,180 |
Source: Public Records
Map
Nearby Homes
- 0 Good Hope Rd
- 211 Woods Rd
- 192 Sfc 322
- 0 Sfc 355
- 481 Sfc 333
- 30+\- Acres Sfc 328
- 802 Sfc 328
- 533 Sfc 311
- 296 Old Military Rd E
- 347 Old Military Rd E
- 0 N Washington St
- 4.59 Acres N Washington St
- 2073 Arkansas 306
- 423 Laughrun Dr
- 361 Yorktown Dr
- 424 Beech Grove Dr
- 220 Lexington Dr
- 308 Trenton Rd
- 717 Laughrun Dr
- 136 Sfc 224