Estimated Value: $317,672 - $359,000
3
Beds
2
Baths
1,576
Sq Ft
$215/Sq Ft
Est. Value
About This Home
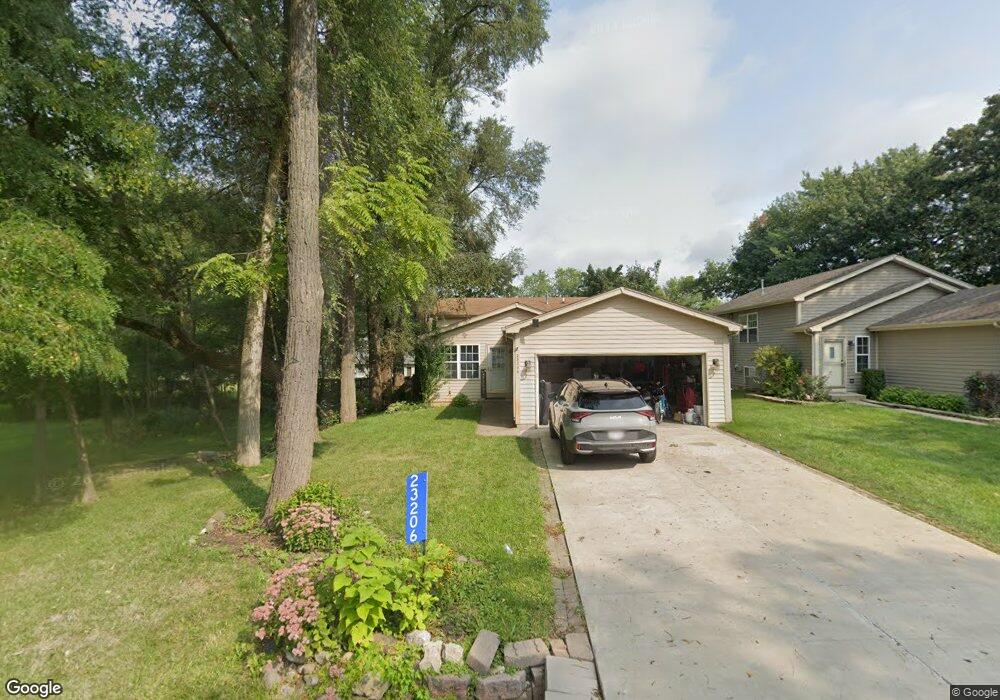
This home is located at 23206 81st Place, Salem, WI 53168 and is currently estimated at $339,418, approximately $215 per square foot. 23206 81st Place is a home located in Kenosha County with nearby schools including Salem Elementary School and Central High School.
Ownership History
Date
Name
Owned For
Owner Type
Purchase Details
Closed on
Oct 30, 2015
Sold by
Renwick Christopher J and Renwick Jessica L
Bought by
Means Gary P and Haley Rebecca A
Current Estimated Value
Home Financials for this Owner
Home Financials are based on the most recent Mortgage that was taken out on this home.
Original Mortgage
$171,830
Outstanding Balance
$142,477
Interest Rate
5.5%
Mortgage Type
FHA
Estimated Equity
$196,941
Purchase Details
Closed on
Jun 30, 2005
Sold by
Debolt Brian D and Debolt Marianne K
Bought by
Renwick Christopher J and Feldmann Jessica L
Home Financials for this Owner
Home Financials are based on the most recent Mortgage that was taken out on this home.
Original Mortgage
$144,000
Interest Rate
5.75%
Mortgage Type
New Conventional
Create a Home Valuation Report for This Property
The Home Valuation Report is an in-depth analysis detailing your home's value as well as a comparison with similar homes in the area
Home Values in the Area
Average Home Value in this Area
Purchase History
| Date | Buyer | Sale Price | Title Company |
|---|---|---|---|
| Means Gary P | $175,000 | None Available | |
| Renwick Christopher J | $180,000 | None Available |
Source: Public Records
Mortgage History
| Date | Status | Borrower | Loan Amount |
|---|---|---|---|
| Open | Means Gary P | $171,830 | |
| Previous Owner | Renwick Christopher J | $144,000 |
Source: Public Records
Tax History Compared to Growth
Tax History
| Year | Tax Paid | Tax Assessment Tax Assessment Total Assessment is a certain percentage of the fair market value that is determined by local assessors to be the total taxable value of land and additions on the property. | Land | Improvement |
|---|---|---|---|---|
| 2024 | $3,927 | $265,900 | $30,500 | $235,400 |
| 2023 | $3,745 | $265,900 | $30,500 | $235,400 |
| 2022 | $3,772 | $222,000 | $27,800 | $194,200 |
| 2021 | $3,824 | $222,000 | $27,800 | $194,200 |
| 2020 | $3,792 | $192,300 | $26,300 | $166,000 |
| 2019 | $3,510 | $192,300 | $26,300 | $166,000 |
| 2018 | $3,150 | $158,800 | $26,300 | $132,500 |
| 2017 | $3,422 | $158,800 | $26,300 | $132,500 |
| 2016 | $3,264 | $145,600 | $24,700 | $120,900 |
| 2015 | $2,912 | $145,200 | $24,700 | $120,500 |
| 2014 | $2,894 | $134,400 | $23,100 | $111,300 |
Source: Public Records
Map
Nearby Homes
- 23305 82nd St
- 23402 82nd Place
- 23600 82nd Place
- 23528 89th St
- Lt2 84th St
- 7705 241st Ave
- 7738 242nd Ave
- 8817 242nd Ave
- 6811 236th Ave
- 8247 Antioch Rd
- 8310 Antioch Rd
- 6605 236th Ave
- 25011 87th St Unit 3
- Lt82 72nd St
- Lot 83 72nd St
- Lt83 72nd St
- Lot 82 72nd St
- 21200 82nd St
- 6504 235th Ave
- 25151 87th St Unit 113
- 23202 81st Place
- 23207 81st Place
- 23203 81st Place
- 23211 81st Place
- 23211 81st Place
- 23202 82nd St
- 23202 82nd St
- 23210 82nd St
- 23221 81st Place
- 23212 81st Place
- 23214 81st Place
- 23216 81st Place
- 23216 81st Place Unit 23216
- 23230 82nd St
- 23304 82nd St
- 23203 82nd St
- 23303 81st Place
- 23207 81st St
- 23220 81st Place
- 23221 81st St