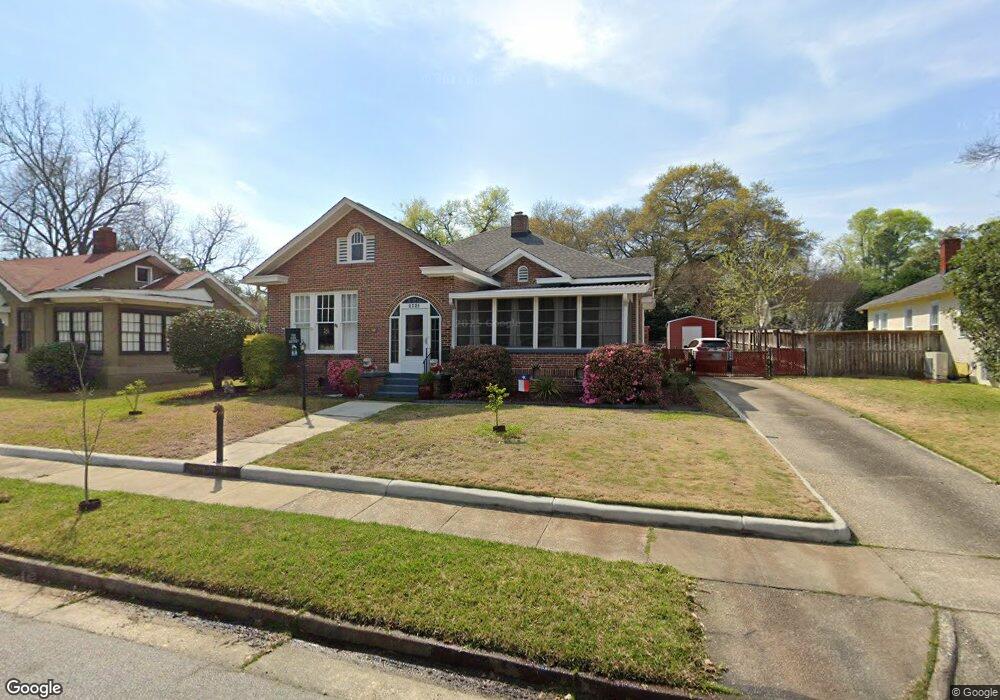
2321 19th Ave Columbus, GA 31901
Saint Elmo Weracoba NeighborhoodEstimated Value: $192,000 - $240,000
2
Beds
2
Baths
1,714
Sq Ft
$127/Sq Ft
Est. Value
About This Home
This home is located at 2321 19th Ave, Columbus, GA 31901 and is currently estimated at $217,375, approximately $126 per square foot. 2321 19th Ave is a home located in Muscogee County with nearby schools including Clubview Elementary School, Richards Middle School, and Jordan Vocational High School.
Ownership History
Date
Name
Owned For
Owner Type
Purchase Details
Closed on
Sep 10, 2019
Sold by
Owens Denise
Bought by
Tyrol James A
Current Estimated Value
Home Financials for this Owner
Home Financials are based on the most recent Mortgage that was taken out on this home.
Original Mortgage
$124,000
Outstanding Balance
$108,614
Interest Rate
3.6%
Mortgage Type
New Conventional
Estimated Equity
$108,761
Purchase Details
Closed on
Jan 28, 2016
Sold by
Sec Of Housing & U
Bought by
Owens Denise Brown
Purchase Details
Closed on
Sep 8, 2015
Sold by
Carrington Mtg Svcs Llc
Bought by
Sec Of Housing & Urban
Purchase Details
Closed on
Jul 7, 2015
Sold by
Fussell Sandra Reich
Bought by
Carrington Mtg Svcs Llc
Create a Home Valuation Report for This Property
The Home Valuation Report is an in-depth analysis detailing your home's value as well as a comparison with similar homes in the area
Home Values in the Area
Average Home Value in this Area
Purchase History
| Date | Buyer | Sale Price | Title Company |
|---|---|---|---|
| Tyrol James A | $155,000 | -- | |
| Owens Denise Brown | $40,000 | -- | |
| Sec Of Housing & Urban | -- | -- | |
| Carrington Mtg Svcs Llc | $91,967 | -- |
Source: Public Records
Mortgage History
| Date | Status | Borrower | Loan Amount |
|---|---|---|---|
| Open | Tyrol James A | $124,000 |
Source: Public Records
Tax History
| Year | Tax Paid | Tax Assessment Tax Assessment Total Assessment is a certain percentage of the fair market value that is determined by local assessors to be the total taxable value of land and additions on the property. | Land | Improvement |
|---|---|---|---|---|
| 2025 | $1,142 | $68,068 | $9,960 | $58,108 |
| 2024 | $1,142 | $68,068 | $9,960 | $58,108 |
| 2023 | $119 | $68,068 | $9,960 | $58,108 |
| 2022 | $1,191 | $56,832 | $9,960 | $46,872 |
| 2021 | $1,191 | $50,664 | $9,960 | $40,704 |
| 2020 | $1,522 | $50,664 | $9,960 | $40,704 |
| 2019 | $2,061 | $50,304 | $9,960 | $40,344 |
| 2018 | $2,061 | $50,304 | $9,960 | $40,344 |
| 2017 | $658 | $16,000 | $3,240 | $12,760 |
| 2016 | $1,515 | $36,723 | $8,467 | $28,256 |
| 2015 | $1,517 | $36,723 | $8,467 | $28,256 |
| 2014 | $718 | $36,723 | $8,467 | $28,256 |
| 2013 | -- | $36,723 | $8,467 | $28,256 |
Source: Public Records
Map
Nearby Homes
Your Personal Tour Guide
Ask me questions while you tour the home.