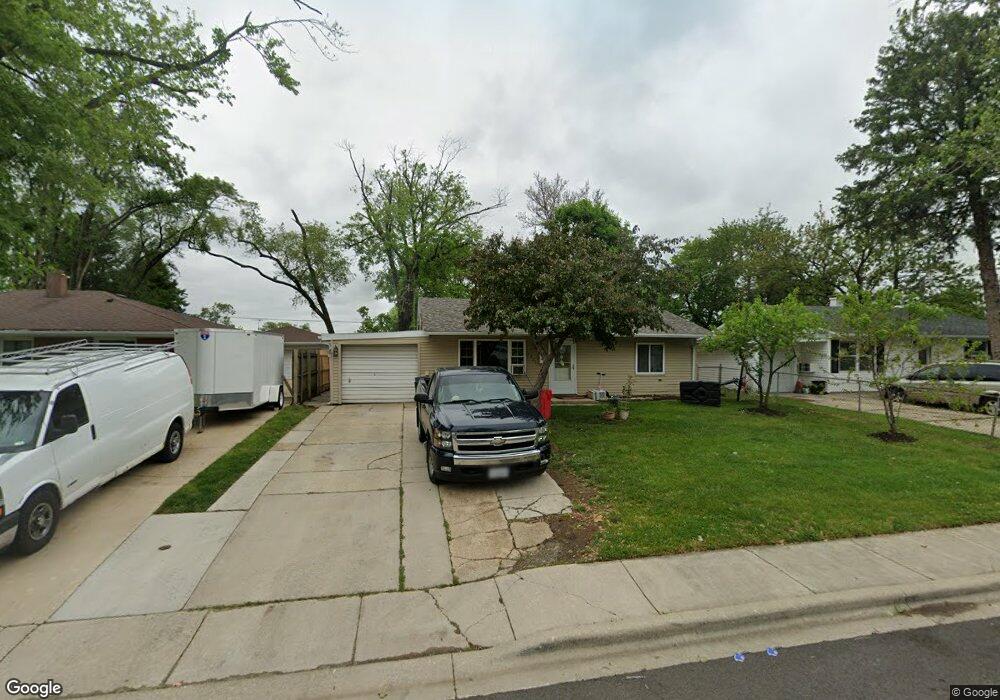
2321 Benedict Ave Joliet, IL 60436
Southwest Joliet NeighborhoodEstimated Value: $210,000 - $272,000
--
Bed
--
Bath
1,288
Sq Ft
$184/Sq Ft
Est. Value
About This Home
This home is located at 2321 Benedict Ave, Joliet, IL 60436 and is currently estimated at $237,055, approximately $184 per square foot. 2321 Benedict Ave is a home located in Will County with nearby schools including Lynne Thigpen Elementary School, Dirksen Junior High School, and Joliet West High School.
Ownership History
Date
Name
Owned For
Owner Type
Purchase Details
Closed on
Apr 5, 2022
Sold by
Rojas and Teresa
Bought by
Leija Selyna
Current Estimated Value
Home Financials for this Owner
Home Financials are based on the most recent Mortgage that was taken out on this home.
Original Mortgage
$162,011
Outstanding Balance
$152,180
Interest Rate
4.25%
Mortgage Type
FHA
Estimated Equity
$84,875
Purchase Details
Closed on
Sep 3, 2010
Sold by
Rojas Angel and Quinones Jose D
Bought by
Rojas Angel
Purchase Details
Closed on
Aug 29, 2001
Sold by
Mcfadden Matt
Bought by
Rojas Angel and Quinones Jose D
Home Financials for this Owner
Home Financials are based on the most recent Mortgage that was taken out on this home.
Original Mortgage
$94,648
Interest Rate
6.97%
Mortgage Type
FHA
Purchase Details
Closed on
May 30, 1997
Sold by
Kraus Paul J
Bought by
Mcfadden Matt
Home Financials for this Owner
Home Financials are based on the most recent Mortgage that was taken out on this home.
Original Mortgage
$79,560
Interest Rate
8.27%
Mortgage Type
VA
Create a Home Valuation Report for This Property
The Home Valuation Report is an in-depth analysis detailing your home's value as well as a comparison with similar homes in the area
Home Values in the Area
Average Home Value in this Area
Purchase History
| Date | Buyer | Sale Price | Title Company |
|---|---|---|---|
| Leija Selyna | $165,000 | Chicago Title | |
| Rojas Angel | -- | None Available | |
| Rojas Angel | $95,500 | Ticor Title | |
| Mcfadden Matt | $78,000 | Chicago Title Insurance Co |
Source: Public Records
Mortgage History
| Date | Status | Borrower | Loan Amount |
|---|---|---|---|
| Open | Leija Selyna | $162,011 | |
| Previous Owner | Rojas Angel | $94,648 | |
| Previous Owner | Mcfadden Matt | $79,560 |
Source: Public Records
Tax History Compared to Growth
Tax History
| Year | Tax Paid | Tax Assessment Tax Assessment Total Assessment is a certain percentage of the fair market value that is determined by local assessors to be the total taxable value of land and additions on the property. | Land | Improvement |
|---|---|---|---|---|
| 2024 | $4,354 | $59,977 | $14,337 | $45,640 |
| 2023 | $4,354 | $53,289 | $12,738 | $40,551 |
| 2022 | $3,898 | $48,203 | $11,522 | $36,681 |
| 2021 | $3,667 | $45,020 | $10,761 | $34,259 |
| 2020 | $3,451 | $42,754 | $10,219 | $32,535 |
| 2019 | $3,242 | $39,734 | $9,497 | $30,237 |
| 2018 | $3,061 | $36,716 | $8,776 | $27,940 |
| 2017 | $2,828 | $33,381 | $7,979 | $25,402 |
| 2016 | $2,645 | $30,609 | $7,306 | $23,303 |
| 2015 | $2,579 | $28,700 | $6,850 | $21,850 |
| 2014 | $2,579 | $28,550 | $6,800 | $21,750 |
| 2013 | $2,579 | $30,752 | $7,565 | $23,187 |
Source: Public Records
Map
Nearby Homes
- 2224 Benedict Ave
- 2300 Webster Ave
- 2302 Madonna Ave
- 2308 Madonna Ave
- 303 S Hammes Ave
- 2365 W Jefferson St
- 116 Saint Jude Ave
- 300 Notre Dame Ave
- 2542 Par Four Ct Unit 12B
- 2632 Crescenzo Dr
- 222 Madison St Unit 208
- 212 Madison St Unit 3B
- 182 Saenz Ln Unit 2E
- 180 Barbara Jean Ln Unit D
- 197 Barbara Jean Ln Unit 4
- 2602 Fairway Dr
- 2604 Fairway Dr
- 2604 Caddy Ln
- 123 Fairlane Dr
- 406 Madison St
- 2323 Benedict Ave
- 2319 Benedict Ave
- 2325 Benedict Ave
- 2317 Benedict Ave
- 2318 Webster Ave
- 2316 Webster Ave
- 2320 Webster Ave
- 2315 Benedict Ave
- 2314 Webster Ave
- 2322 Webster Ave
- 2222 Benedict Ave
- 2300 Benedict Ave
- 2220 Benedict Ave
- 2312 Webster Ave
- 2329 Benedict Ave
- 2302 Benedict Ave
- 2324 Webster Ave
- 2313 Benedict Ave
- 2218 Benedict Ave
- 2304 Benedict Ave