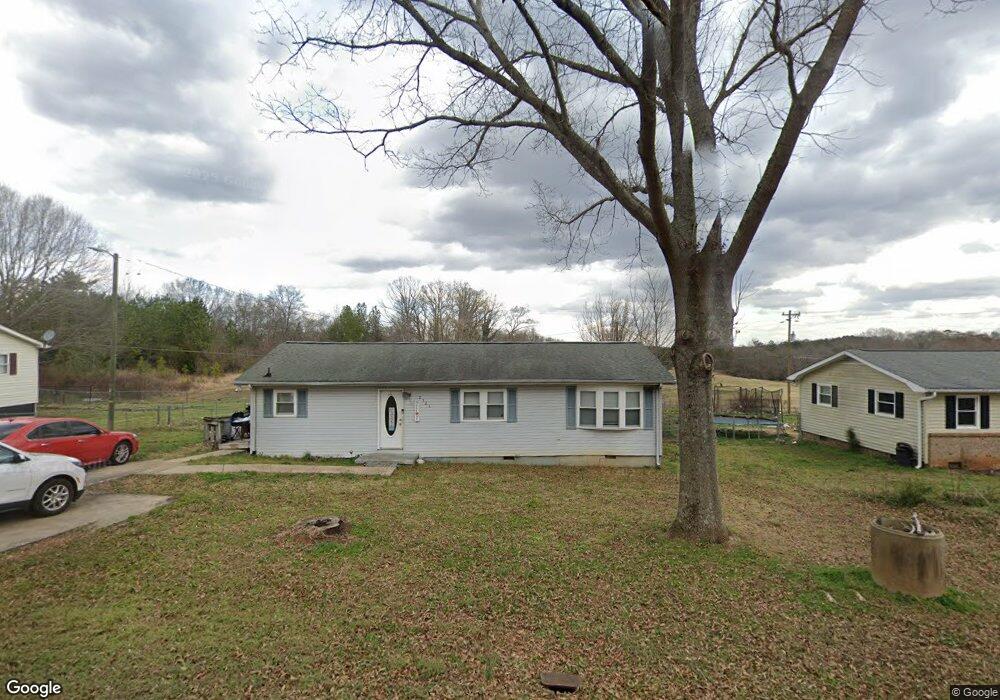
2321 Flint Hill Church Rd Shelby, NC 28152
Estimated Value: $137,000 - $168,000
--
Bed
--
Bath
1,248
Sq Ft
$127/Sq Ft
Est. Value
About This Home
This home is located at 2321 Flint Hill Church Rd, Shelby, NC 28152 and is currently estimated at $159,095, approximately $127 per square foot. 2321 Flint Hill Church Rd is a home located in Cleveland County with nearby schools including Boiling Springs Elementary School, Crest Middle School, and Crest High School.
Ownership History
Date
Name
Owned For
Owner Type
Purchase Details
Closed on
Oct 18, 2024
Sold by
Nunns Kevin Michael and Kelly Rebecca
Bought by
College Property Services Llc
Current Estimated Value
Purchase Details
Closed on
Apr 11, 2019
Sold by
Nunns Rebecca
Bought by
Nunns Kevin
Purchase Details
Closed on
Feb 10, 2016
Sold by
Branton Virginia P
Bought by
Us Bank Trust Na and Lsf8 Master Participation Trust
Purchase Details
Closed on
Apr 30, 2007
Sold by
Branton Virginia P
Bought by
Branton Virginia P
Home Financials for this Owner
Home Financials are based on the most recent Mortgage that was taken out on this home.
Original Mortgage
$102,000
Interest Rate
6.11%
Mortgage Type
New Conventional
Create a Home Valuation Report for This Property
The Home Valuation Report is an in-depth analysis detailing your home's value as well as a comparison with similar homes in the area
Home Values in the Area
Average Home Value in this Area
Purchase History
| Date | Buyer | Sale Price | Title Company |
|---|---|---|---|
| College Property Services Llc | -- | None Listed On Document | |
| College Property Services Llc | -- | None Listed On Document | |
| Nunns Kevin | -- | None Available | |
| Us Bank Trust Na | $59,503 | None Available | |
| Branton Virginia P | -- | None Available |
Source: Public Records
Mortgage History
| Date | Status | Borrower | Loan Amount |
|---|---|---|---|
| Previous Owner | Branton Virginia P | $102,000 |
Source: Public Records
Tax History Compared to Growth
Tax History
| Year | Tax Paid | Tax Assessment Tax Assessment Total Assessment is a certain percentage of the fair market value that is determined by local assessors to be the total taxable value of land and additions on the property. | Land | Improvement |
|---|---|---|---|---|
| 2025 | $813 | $128,040 | $13,219 | $114,821 |
| 2024 | $530 | $56,548 | $11,016 | $45,532 |
| 2023 | $528 | $56,548 | $11,016 | $45,532 |
| 2022 | $527 | $56,548 | $11,016 | $45,532 |
| 2021 | $528 | $56,548 | $11,016 | $45,532 |
| 2020 | $463 | $47,029 | $10,410 | $36,619 |
| 2019 | $411 | $47,029 | $10,410 | $36,619 |
| 2018 | $459 | $47,029 | $10,410 | $36,619 |
| 2017 | $456 | $47,029 | $10,410 | $36,619 |
| 2016 | $434 | $47,029 | $10,410 | $36,619 |
| 2015 | $496 | $54,883 | $9,859 | $45,024 |
| 2014 | $496 | $54,883 | $9,859 | $45,024 |
Source: Public Records
Map
Nearby Homes
- 118 Southern Pine Dr
- 107 Southern Pines Dr
- 000 Oak St E
- 0000 Oak St E
- 1336 Mount Sinai Church Rd
- TBD Patrick Ave
- 1815 Gaffney Rd
- 0 Patrick Ave Unit LotWP001
- 1622 Patrick Ave
- 133 Brookview Dr
- 125 Flint Hill Church Rd
- 1033 College Ave
- 1214 Maple Springs Ch Rd
- 231 Pineland Ave Unit 1
- 1013 Point Crossing Ct Unit 25
- 1617 Red Rd
- 322 S Main St
- 301 Oak Ave
- 00 Ranchfield Dr
- 109 Ocean Dr
- 2323 Flint Hill Church Rd
- 2319 Flint Hill Church Rd
- 2317 Flint Hill Church Rd
- 2316 Flint Hill Church Rd
- 2324 Flint Hill Church Rd
- 2313 Flint Hill Church Rd
- 2329 Flint Hill Church Rd
- 2325 Flint Hill Church Rd
- 111 Hurst Farm Rd
- 2326 Fln Hl Chur Rd Unit 6
- 2305 Flint Hill Church Rd
- 2305 Flint Hill Church Rd
- 2314 Flint Hill Church Rd
- 2311 Flint Hill Church Rd Unit 3
- 2311 Flint Hill Church Rd Unit 1
- 2339 Flint Hill Church Rd
- 2300 Flint Hill Church Rd
- 115 Maudie Ln
- 2260 Flint Hill Church Rd
- 104 Stillwater Rd Unit 10