Estimated Value: $595,000 - $672,000
--
Bed
--
Bath
1,682
Sq Ft
$376/Sq Ft
Est. Value
About This Home
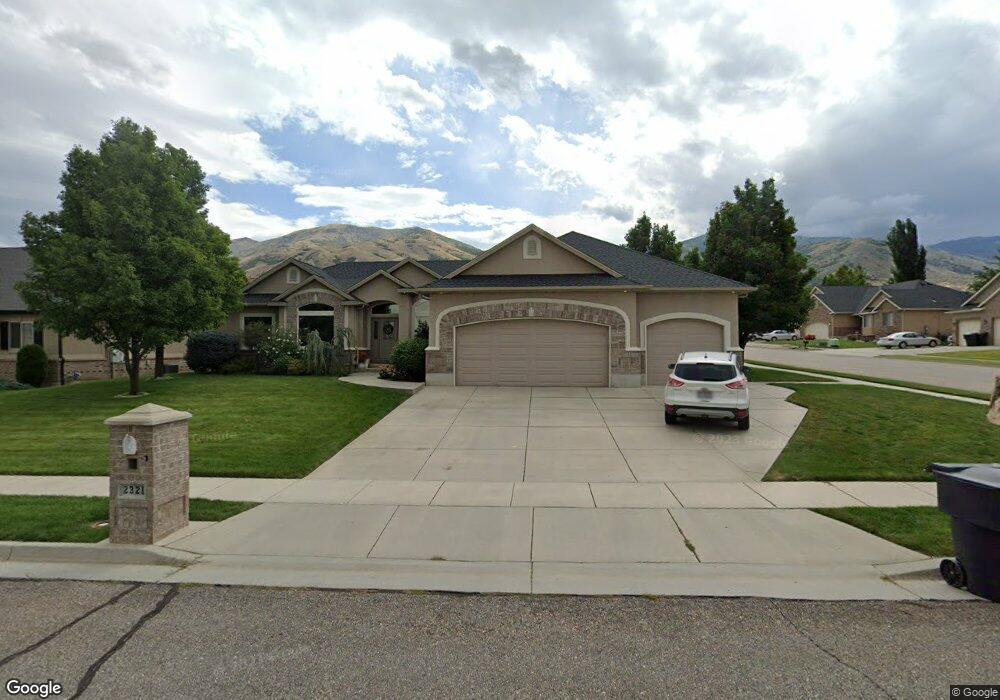
This home is located at 2321 Linda Way Unit 14, Perry, UT 84302 and is currently estimated at $632,825, approximately $376 per square foot. 2321 Linda Way Unit 14 is a home located in Box Elder County with nearby schools including Three Mile Creek School, Adele C. Young Intermediate School, and Box Elder Middle School.
Ownership History
Date
Name
Owned For
Owner Type
Purchase Details
Closed on
Oct 26, 2021
Sold by
Matthews Robn W and Malan Robin Wilkinson
Bought by
Webb Keith R
Current Estimated Value
Home Financials for this Owner
Home Financials are based on the most recent Mortgage that was taken out on this home.
Original Mortgage
$1,664,700
Outstanding Balance
$1,524,353
Interest Rate
3.09%
Estimated Equity
-$891,528
Purchase Details
Closed on
Aug 26, 2010
Sold by
Wilkinson June
Bought by
Malan Robin Wilkinson
Home Financials for this Owner
Home Financials are based on the most recent Mortgage that was taken out on this home.
Original Mortgage
$64,000
Interest Rate
4.51%
Mortgage Type
New Conventional
Purchase Details
Closed on
Jun 20, 2006
Sold by
Kidco Management Lc
Bought by
Malan Robin Wilkinson and Milkinson June
Create a Home Valuation Report for This Property
The Home Valuation Report is an in-depth analysis detailing your home's value as well as a comparison with similar homes in the area
Home Values in the Area
Average Home Value in this Area
Purchase History
| Date | Buyer | Sale Price | Title Company |
|---|---|---|---|
| Webb Keith R | -- | Phillips Hansen Land Title | |
| Malan Robin Wilkinson | -- | None Available | |
| Malan Robin Wilkinson | -- | None Available |
Source: Public Records
Mortgage History
| Date | Status | Borrower | Loan Amount |
|---|---|---|---|
| Open | Webb Keith R | $1,664,700 | |
| Previous Owner | Malan Robin Wilkinson | $64,000 |
Source: Public Records
Tax History Compared to Growth
Tax History
| Year | Tax Paid | Tax Assessment Tax Assessment Total Assessment is a certain percentage of the fair market value that is determined by local assessors to be the total taxable value of land and additions on the property. | Land | Improvement |
|---|---|---|---|---|
| 2025 | $4,178 | $653,235 | $165,000 | $488,235 |
| 2024 | $3,513 | $615,184 | $160,000 | $455,184 |
| 2023 | $3,518 | $627,631 | $160,000 | $467,631 |
| 2022 | $3,391 | $567,318 | $65,000 | $502,318 |
| 2021 | $2,900 | $372,531 | $65,000 | $307,531 |
| 2020 | $2,573 | $372,531 | $65,000 | $307,531 |
| 2019 | $2,469 | $189,582 | $33,000 | $156,582 |
| 2018 | $2,243 | $169,158 | $33,000 | $136,158 |
| 2017 | $2,445 | $307,560 | $33,000 | $247,560 |
| 2016 | $2,416 | $162,674 | $33,000 | $129,674 |
| 2015 | $2,204 | $150,886 | $33,000 | $117,886 |
| 2014 | $2,204 | $145,272 | $32,010 | $113,262 |
| 2013 | -- | $134,976 | $32,010 | $102,966 |
Source: Public Records
Map
Nearby Homes
- 2230 S 635 W Unit C
- 2230 S 635 W Unit D
- 2484 S 900 W
- Hadleigh Plan at West Meadows
- Edgeworth Plan at West Meadows
- Hyland Plan at West Meadows
- Cambria Plan at West Meadows
- Stanton Plan at West Meadows
- Ravenstone Plan at West Meadows
- Clearpoint Plan at West Meadows
- Aldin Plan at West Meadows
- Northfield Plan at West Meadows
- Norfolk Plan at West Meadows
- Kensington Plan at West Meadows
- Winfield Plan at West Meadows
- Hallwood Plan at West Meadows
- Westbrook Plan at West Meadows
- Foxhill Plan at West Meadows
- Vanbrough Plan at West Meadows
- Canyon Plan at West Meadows
- 2321 Linda Way
- 2311 Linda Way Unit 13
- 2311 Linda Way
- 2320 S Madison Cir Unit 15
- 2320 S Madison Cir
- 896 W 2325 S
- 970 W 2325 S
- 905 W 2325 S Unit 6
- 905 W 2325 S
- 915 W 2325 S Unit 7
- 915 W 2325 S
- 2310 Madison Cir
- 2310 Madison Cir Unit 16
- 2295 Linda Way
- 2295 Linda Way Unit 12
- 893 W 2325 S
- 893 W 2325 S Unit 5
- 2308 Linda Way Unit 10
- 2339 Linda Way
- 2339 Linda Way Unit 8