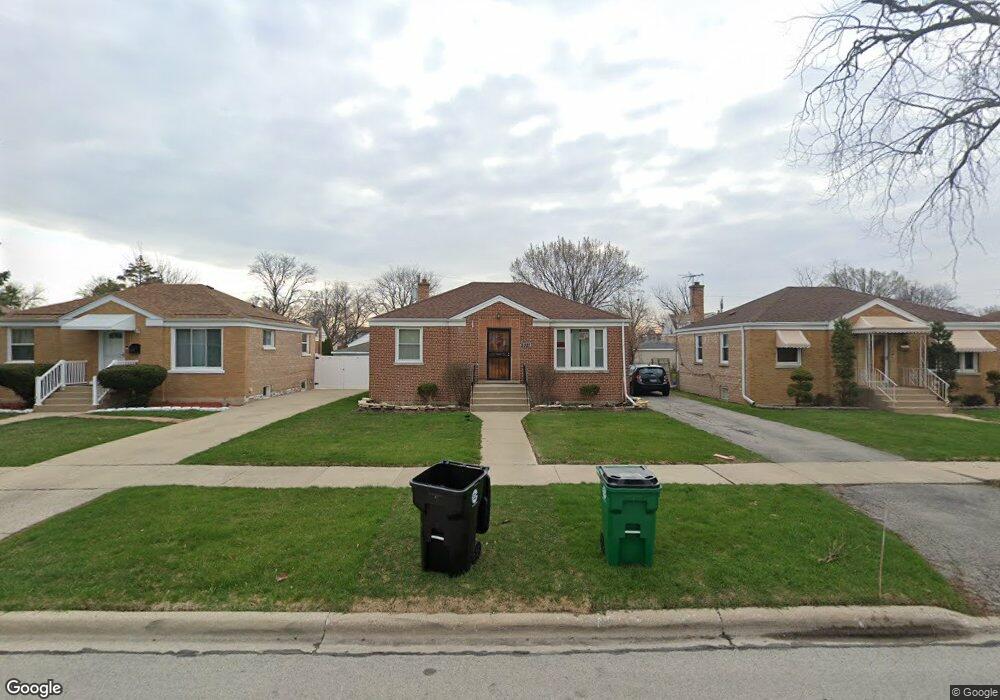
2321 S 23rd Ave Broadview, IL 60155
Estimated Value: $259,000 - $289,000
2
Beds
1
Bath
925
Sq Ft
$290/Sq Ft
Est. Value
About This Home
This home is located at 2321 S 23rd Ave, Broadview, IL 60155 and is currently estimated at $268,132, approximately $289 per square foot. 2321 S 23rd Ave is a home located in Cook County with nearby schools including Lindop Elementary School and Proviso East High School.
Ownership History
Date
Name
Owned For
Owner Type
Purchase Details
Closed on
Aug 26, 2017
Sold by
Smith Charlestine L and Wilson Charlestine L
Bought by
Reyes Demetrio
Current Estimated Value
Home Financials for this Owner
Home Financials are based on the most recent Mortgage that was taken out on this home.
Original Mortgage
$148,410
Outstanding Balance
$123,081
Interest Rate
4%
Mortgage Type
New Conventional
Estimated Equity
$145,051
Purchase Details
Closed on
Oct 21, 1994
Sold by
Settlers Housing Service Inc
Bought by
Smith Charlestine L
Home Financials for this Owner
Home Financials are based on the most recent Mortgage that was taken out on this home.
Original Mortgage
$85,000
Interest Rate
8.53%
Create a Home Valuation Report for This Property
The Home Valuation Report is an in-depth analysis detailing your home's value as well as a comparison with similar homes in the area
Home Values in the Area
Average Home Value in this Area
Purchase History
| Date | Buyer | Sale Price | Title Company |
|---|---|---|---|
| Reyes Demetrio | $153,000 | Greater Illinois Title | |
| Smith Charlestine L | -- | -- |
Source: Public Records
Mortgage History
| Date | Status | Borrower | Loan Amount |
|---|---|---|---|
| Open | Reyes Demetrio | $148,410 | |
| Previous Owner | Smith Charlestine L | $85,000 |
Source: Public Records
Tax History
| Year | Tax Paid | Tax Assessment Tax Assessment Total Assessment is a certain percentage of the fair market value that is determined by local assessors to be the total taxable value of land and additions on the property. | Land | Improvement |
|---|---|---|---|---|
| 2025 | $5,919 | $21,000 | $3,685 | $17,315 |
| 2024 | $5,919 | $21,000 | $3,685 | $17,315 |
| 2023 | $5,024 | $21,000 | $3,685 | $17,315 |
| 2022 | $5,024 | $15,537 | $2,680 | $12,857 |
| 2021 | $4,792 | $15,537 | $2,680 | $12,857 |
| 2020 | $4,736 | $15,537 | $2,680 | $12,857 |
| 2019 | $3,909 | $12,649 | $2,512 | $10,137 |
| 2018 | $5,368 | $12,649 | $2,512 | $10,137 |
| 2017 | $3,876 | $12,649 | $2,512 | $10,137 |
| 2016 | $3,647 | $10,818 | $2,345 | $8,473 |
| 2015 | $3,549 | $10,818 | $2,345 | $8,473 |
| 2014 | $3,491 | $10,818 | $2,345 | $8,473 |
| 2013 | $3,613 | $11,866 | $2,345 | $9,521 |
Source: Public Records
Map
Nearby Homes
- 2341 S 24th Ave
- 2247 S 21st Ave
- 2116 S 21st Ave
- 2111 S 24th Ave
- 2433 S 17th Ave
- 2510 S 17th Ave
- 2007 S 25th Ave
- 1433 Bristol Ave
- 1457 Bristol Ave
- 1925 S 22nd Ave
- 1926 S 24th Ave
- 1910 S 22nd Ave
- 1908 S 23rd Ave
- 1909 S 20th Ave
- 2127 S 15th Ave
- 1839 S 22nd Ave
- 2036 S 15th Ave
- 1449 Norfolk Ave
- 1924 S 17th Ave
- 1908 S 18th Ave
- 2325 S 23rd Ave
- 2317 S 23rd Ave
- 2313 S 23rd Ave
- 2329 S 23rd Ave
- 2324 S 22nd Ave Unit ID1237876P
- 2316 S 22nd Ave
- 2309 S 23rd Ave
- 2333 S 23rd Ave
- 2312 S 22nd Ave
- 2328 S 22nd Ave
- 2320 S 23rd Ave
- 2305 S 23rd Ave
- 2337 S 23rd Ave
- 2332 S 22nd Ave
- 2308 S 22nd Ave
- 2316 S 23rd Ave
- 2324 S 23rd Ave
- 2328 S 23rd Ave
- 2312 S 23rd Ave
- 2304 S 22nd Ave
Your Personal Tour Guide
Ask me questions while you tour the home.