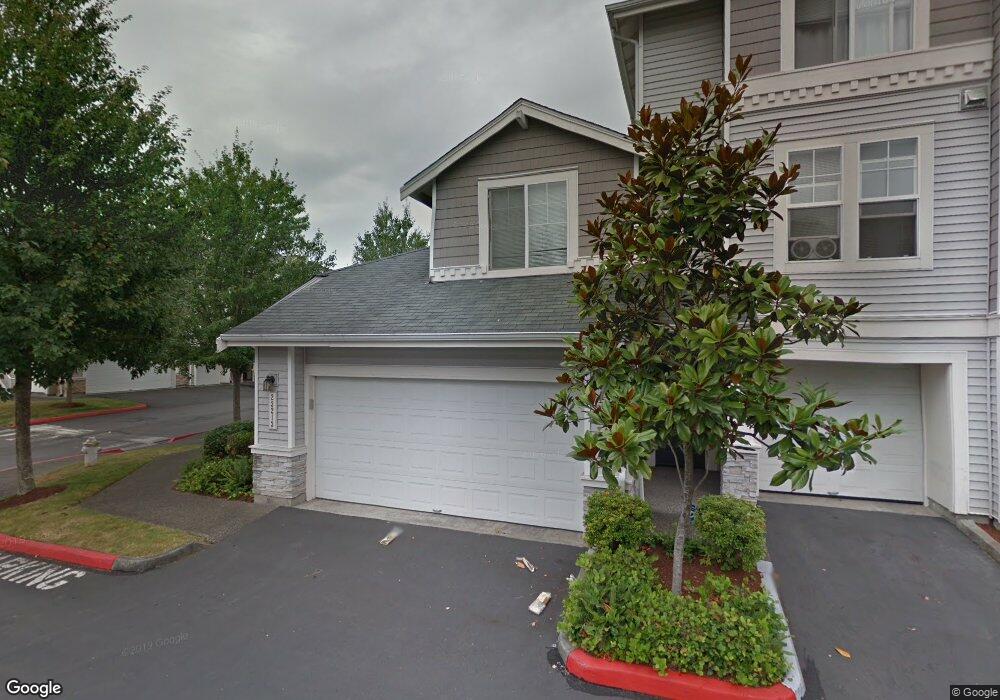
23213 61st Place S Unit 15-1 Kent, WA 98032
The Lakes NeighborhoodEstimated Value: $484,000 - $528,000
2
Beds
3
Baths
1,501
Sq Ft
$334/Sq Ft
Est. Value
About This Home
This home is located at 23213 61st Place S Unit 15-1, Kent, WA 98032 and is currently estimated at $501,142, approximately $333 per square foot. 23213 61st Place S Unit 15-1 is a home located in King County with nearby schools including Neely O Brien Elementary School, Mill Creek Middle School, and Kent-Meridian High School.
Ownership History
Date
Name
Owned For
Owner Type
Purchase Details
Closed on
Jul 30, 2012
Sold by
Sisco Brian E
Bought by
Bayview Townhomes Homeowners Association
Current Estimated Value
Purchase Details
Closed on
Oct 6, 2006
Sold by
Sisco Sarah
Bought by
Sisco Brian E
Home Financials for this Owner
Home Financials are based on the most recent Mortgage that was taken out on this home.
Original Mortgage
$297,648
Interest Rate
6.44%
Mortgage Type
VA
Purchase Details
Closed on
Nov 29, 2001
Sold by
Meckley Michael J and Meckley Randee M
Bought by
Do Chan Quoc and Tran Uyen Nocg
Home Financials for this Owner
Home Financials are based on the most recent Mortgage that was taken out on this home.
Original Mortgage
$192,800
Interest Rate
6.63%
Create a Home Valuation Report for This Property
The Home Valuation Report is an in-depth analysis detailing your home's value as well as a comparison with similar homes in the area
Home Values in the Area
Average Home Value in this Area
Purchase History
| Date | Buyer | Sale Price | Title Company |
|---|---|---|---|
| Bayview Townhomes Homeowners Association | -- | None Available | |
| Sisco Brian E | -- | Ticor National | |
| Sisco Brian E | $288,000 | Ticor National | |
| Do Chan Quoc | $203,000 | Transnation Title Insurance |
Source: Public Records
Mortgage History
| Date | Status | Borrower | Loan Amount |
|---|---|---|---|
| Previous Owner | Sisco Brian E | $297,648 | |
| Previous Owner | Do Chan Quoc | $192,800 |
Source: Public Records
Tax History Compared to Growth
Tax History
| Year | Tax Paid | Tax Assessment Tax Assessment Total Assessment is a certain percentage of the fair market value that is determined by local assessors to be the total taxable value of land and additions on the property. | Land | Improvement |
|---|---|---|---|---|
| 2024 | $4,783 | $469,000 | $34,200 | $434,800 |
| 2023 | $4,565 | $475,000 | $32,500 | $442,500 |
| 2022 | $4,240 | $433,000 | $32,500 | $400,500 |
| 2021 | $4,144 | $358,000 | $32,500 | $325,500 |
| 2020 | $4,086 | $334,000 | $32,500 | $301,500 |
| 2018 | $3,743 | $316,000 | $27,400 | $288,600 |
| 2017 | $3,078 | $286,000 | $27,400 | $258,600 |
| 2016 | $3,018 | $238,000 | $26,900 | $211,100 |
| 2015 | -- | $221,000 | $26,900 | $194,100 |
| 2014 | -- | $200,000 | $27,400 | $172,600 |
| 2013 | -- | $137,000 | $27,400 | $109,600 |
Source: Public Records
Map
Nearby Homes
- 23228 59th Ct S
- 23402 62nd Ave S
- 23331 59th Place S Unit 16-4
- 5812 S 234th St
- 23512 55th Ave S Unit 16
- 23606 55th Ave S Unit 11-03
- 5736 S 238th Ct Unit E4
- 23420 54th Ave S Unit 25-1
- 5403 S 236th St Unit 2
- 23955 58th Ct S Unit E1
- 5319 S 236th St Unit 6
- 23959 58th Ct S Unit C-1
- 5509 S 237th Place Unit 12-3
- 5409 S 237th Place Unit 16-4
- 6711 S 239th Place Unit A104
- 23907 67th Place S Unit C102
- 23809 W Valley Hwy S
- 23425 51st Ave S
- 1313 W James St Unit 9
- 1611 W Smith Ct Unit 11
- 23213 61st Place S
- 23209 61st Place S
- 23211 61st Place S
- 23207 61st Place S
- 23400 Lakeside Blvd E Unit E31-2
- 23400 Lakeside Blvd E Unit 7-4
- 23216 61st Place S Unit 17
- 6113 S 233rd St Unit 12-1
- 6111 S 233rd St
- 6109 S 233rd St Unit 12-3
- 6109 S 233rd St
- 23218 61st Place S
- 6105 S 233rd St
- 6105 S 233rd St Unit 12-5
- 6107 S 233rd St Unit 12-4
- 23216 60th Ct S
- 6119 S 232nd St Unit 16-6
- 23220 60th Ct S Unit 14-4
- 23212 60th Ct S
- 23208 60th Ct S