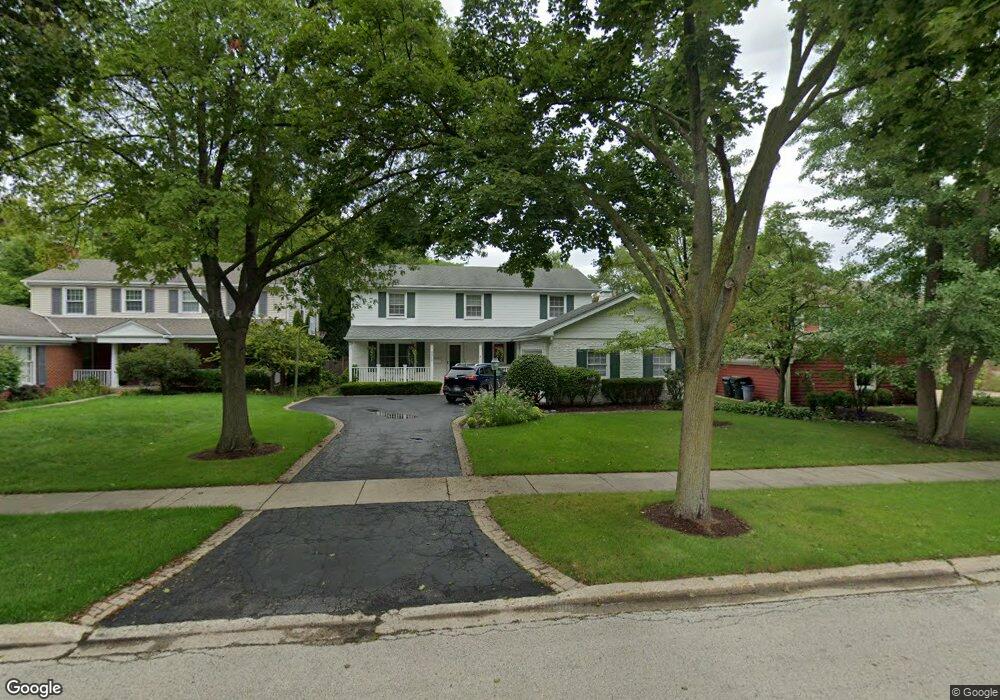
2322 Maple Ave Northbrook, IL 60062
Estimated Value: $956,794 - $1,329,000
6
Beds
4
Baths
3,201
Sq Ft
$354/Sq Ft
Est. Value
About This Home
This home is located at 2322 Maple Ave, Northbrook, IL 60062 and is currently estimated at $1,132,699, approximately $353 per square foot. 2322 Maple Ave is a home located in Cook County with nearby schools including Greenbriar Elementary School, Northbrook Junior High School, and Glenbrook North High School.
Ownership History
Date
Name
Owned For
Owner Type
Purchase Details
Closed on
May 23, 2024
Sold by
Porcaro Robert
Bought by
Robert K Porcaro Trust and Porcaro
Current Estimated Value
Purchase Details
Closed on
Jun 23, 2006
Sold by
Browne Jonathan H and Browne Kathryn S
Bought by
Porcaro Robert and Porcaro Mary
Home Financials for this Owner
Home Financials are based on the most recent Mortgage that was taken out on this home.
Original Mortgage
$405,000
Interest Rate
6.73%
Mortgage Type
Unknown
Purchase Details
Closed on
Oct 28, 1996
Sold by
Busch Jeffrey D and Busch Sandra S
Bought by
Browne Jonathan H and Browne Kathryn S
Home Financials for this Owner
Home Financials are based on the most recent Mortgage that was taken out on this home.
Original Mortgage
$418,400
Interest Rate
7.12%
Create a Home Valuation Report for This Property
The Home Valuation Report is an in-depth analysis detailing your home's value as well as a comparison with similar homes in the area
Home Values in the Area
Average Home Value in this Area
Purchase History
| Date | Buyer | Sale Price | Title Company |
|---|---|---|---|
| Robert K Porcaro Trust | -- | None Listed On Document | |
| Porcaro Robert | $830,000 | Multiple | |
| Browne Jonathan H | $523,000 | -- |
Source: Public Records
Mortgage History
| Date | Status | Borrower | Loan Amount |
|---|---|---|---|
| Previous Owner | Porcaro Robert | $405,000 | |
| Previous Owner | Browne Jonathan H | $418,400 |
Source: Public Records
Tax History
| Year | Tax Paid | Tax Assessment Tax Assessment Total Assessment is a certain percentage of the fair market value that is determined by local assessors to be the total taxable value of land and additions on the property. | Land | Improvement |
|---|---|---|---|---|
| 2025 | $15,691 | $99,000 | $18,810 | $80,190 |
| 2024 | $15,691 | $72,000 | $15,840 | $56,160 |
| 2023 | $15,196 | $72,000 | $15,840 | $56,160 |
| 2022 | $15,196 | $72,000 | $15,840 | $56,160 |
| 2021 | $17,434 | $73,114 | $12,127 | $60,987 |
| 2020 | $17,140 | $73,114 | $12,127 | $60,987 |
| 2019 | $16,638 | $80,345 | $12,127 | $68,218 |
| 2018 | $15,625 | $70,159 | $10,642 | $59,517 |
| 2017 | $15,235 | $70,159 | $10,642 | $59,517 |
| 2016 | $14,517 | $70,159 | $10,642 | $59,517 |
| 2015 | $12,708 | $56,262 | $8,662 | $47,600 |
| 2014 | $12,151 | $56,262 | $8,662 | $47,600 |
| 2013 | $11,763 | $56,262 | $8,662 | $47,600 |
Source: Public Records
Map
Nearby Homes
- 2335 Maple Ave
- 2444 Oak Ave
- 1331 Pfingsten Rd
- 1817 Somerset Ln Unit 24
- 1060 Cedar Ln
- 1772 Lancaster Way
- 1041 Cedar Ln
- 1914 Farnsworth Ln Unit 208
- 1814 Illinois Rd
- 1943 Sunnyside Cir
- 1021 Cedar Ln
- 2700 Crabtree Ln
- 847 Division St
- 2348 Ash Ln
- 1255 Shermer Rd
- 818 Bach St
- 1443 Church St
- 1209 Gateway Ct
- 1444 Sycamore Ln
- 1941 Kingsley Cir
- 2318 Maple Ave
- 2324 Maple Ave
- 2312 Maple Ave
- 2334 Maple Ave
- 2308 Maple Ave
- 2340 Maple Ave
- 2323 Maple Ave
- 2319 Walters Ave
- 2329 Walters Ave
- 2321 Maple Ave
- 2327 Maple Ave
- 2323 Walters Ave
- 2335 Walters Ave
- 2313 Maple Ave
- 2317 Walters Ave
- 2300 Maple Ave
- 2344 Maple Ave
- 2307 Maple Ave
- 2339 Walters Ave
- 2345 Maple Ave
Your Personal Tour Guide
Ask me questions while you tour the home.