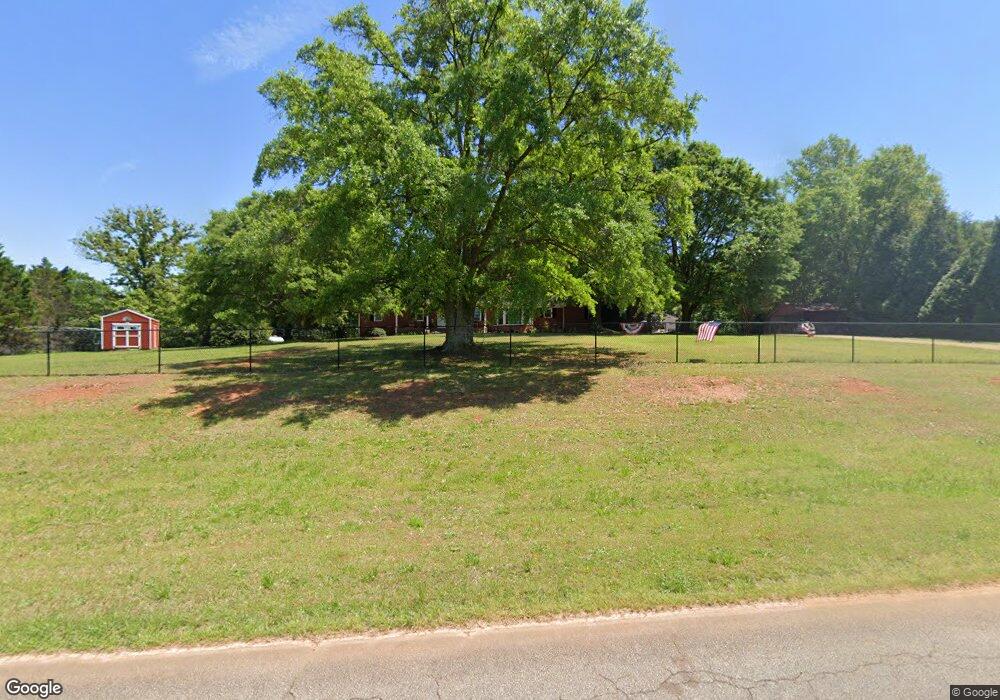
2322 Pleasant Grove Rd Bowman, GA 30624
Estimated Value: $354,000 - $483,716
4
Beds
3
Baths
4,291
Sq Ft
$102/Sq Ft
Est. Value
About This Home
This home is located at 2322 Pleasant Grove Rd, Bowman, GA 30624 and is currently estimated at $437,929, approximately $102 per square foot. 2322 Pleasant Grove Rd is a home located in Elbert County with nearby schools including Elbert County Elementary School, Elbert County Primary School, and Elbert County Middle School.
Ownership History
Date
Name
Owned For
Owner Type
Purchase Details
Closed on
Mar 31, 2022
Sold by
Mitchell Raymond D
Bought by
Stack Stephen A and Stack Anne A
Current Estimated Value
Home Financials for this Owner
Home Financials are based on the most recent Mortgage that was taken out on this home.
Original Mortgage
$555,000
Outstanding Balance
$551,843
Interest Rate
3.93%
Mortgage Type
FHA
Estimated Equity
-$113,914
Purchase Details
Closed on
Nov 10, 2010
Sold by
Mitchell Charlie Anne
Bought by
Mitchell Raymond D
Home Financials for this Owner
Home Financials are based on the most recent Mortgage that was taken out on this home.
Original Mortgage
$255,000
Interest Rate
4.33%
Purchase Details
Closed on
Nov 12, 1999
Sold by
Bruce Gregory Allen
Bought by
Mitchell Raymond D
Create a Home Valuation Report for This Property
The Home Valuation Report is an in-depth analysis detailing your home's value as well as a comparison with similar homes in the area
Home Values in the Area
Average Home Value in this Area
Purchase History
| Date | Buyer | Sale Price | Title Company |
|---|---|---|---|
| Stack Stephen A | $370,000 | -- | |
| Mitchell Raymond D | -- | -- | |
| Mitchell Raymond D | $98,000 | -- |
Source: Public Records
Mortgage History
| Date | Status | Borrower | Loan Amount |
|---|---|---|---|
| Open | Stack Stephen A | $555,000 | |
| Closed | Stack Stephen A | $555,000 | |
| Previous Owner | Mitchell Raymond D | $255,000 |
Source: Public Records
Tax History Compared to Growth
Tax History
| Year | Tax Paid | Tax Assessment Tax Assessment Total Assessment is a certain percentage of the fair market value that is determined by local assessors to be the total taxable value of land and additions on the property. | Land | Improvement |
|---|---|---|---|---|
| 2024 | $3,625 | $156,507 | $12,995 | $143,512 |
| 2023 | $3,421 | $156,507 | $12,995 | $143,512 |
| 2022 | $2,577 | $109,480 | $7,736 | $101,744 |
| 2021 | $2,581 | $109,480 | $7,736 | $101,744 |
| 2020 | $2,639 | $99,074 | $6,188 | $92,886 |
| 2019 | $2,741 | $99,074 | $6,188 | $92,886 |
| 2018 | $2,502 | $99,074 | $6,188 | $92,886 |
| 2017 | $2,829 | $92,059 | $6,188 | $85,871 |
| 2016 | $2,643 | $92,059 | $6,188 | $85,871 |
| 2015 | -- | $91,500 | $6,188 | $85,312 |
| 2014 | -- | $91,500 | $6,188 | $85,312 |
| 2013 | -- | $91,113 | $6,188 | $84,925 |
Source: Public Records
Map
Nearby Homes
- 0 Dusty Rd Unit 10569563
- 0 Dusty Rd Unit 7619983
- 1683 Dove-Drake Rd
- 2587 Quill Rd
- 1458 & 1463 Parham Town Rd
- 375 S Broad St
- 397 Reed Brawner Rd
- 0 Five Forks Rd Unit 10619685
- 40 W Hendricks St
- 3075 Sycamore Rd
- 2970 Davids Home Church Rd
- 4059 Wildcat Bridge Rd
- 0 Bowers St Unit LOT 1-8 CL335681
- 0 Bowers St Unit LOT 1-8 10576344
- 1825 Seymour Rd
- 384 Freedom Church Rd
- 3657 Wildcat Bridge Rd
- 233 Duncan Rd
- 417 Cheek Pulliam Rd
- 3322 Cheek Pulliam Rd
- 2336 Pleasant Grove Rd
- 2336 Pleasant Grove Church Rd
- 2302 Pleasant Grove Rd
- 2220 Corinth Church Rd
- 2356 Dusty Rd
- 2361 Pleasant Grove Church Rd
- 2370 Pleasant Grove Rd
- 2223 Corinth Church Rd
- 2292 Corinth Church Rd
- 2361 Pleasant Grove Rd
- 2361 Pleasant Grove Rd
- 2320 Dusty Rd
- 2219 Corinth Church Rd
- 2331 Dusty Rd
- 2325 Dusty Rd
- 2311 Factory Hole Rd
- 3525 Moon Farm Rd
- 2266 Bryant Dr
- 2383 Pleasant Grove Rd
- 2375 Factory Hole Dr