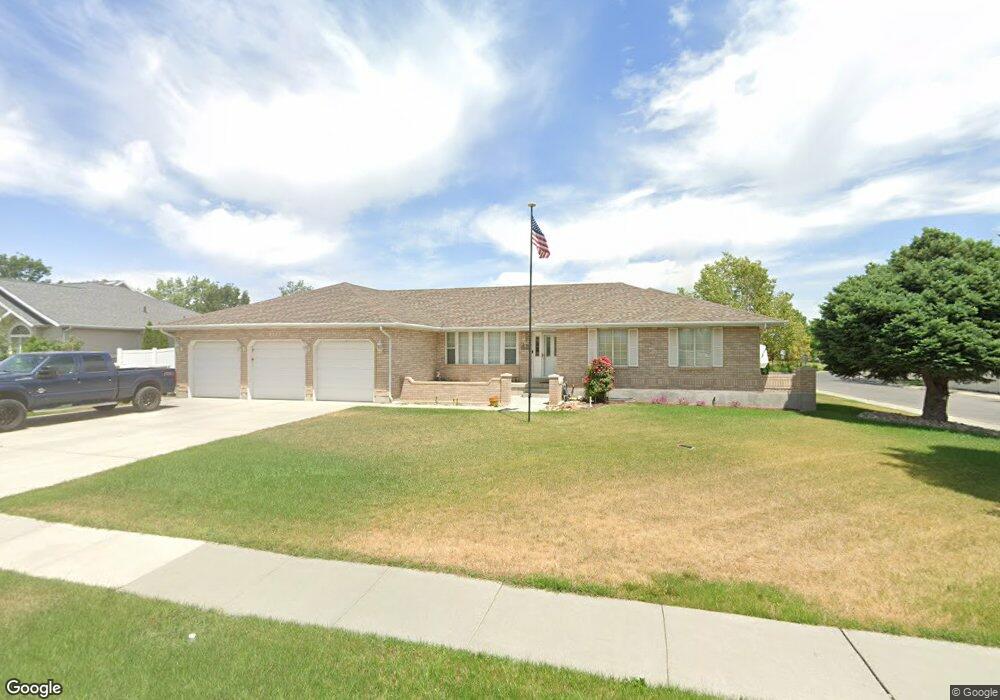
2322 W Hobbs Dr South Jordan, UT 84095
Estimated Value: $797,000 - $887,000
6
Beds
4
Baths
4,106
Sq Ft
$207/Sq Ft
Est. Value
About This Home
This home is located at 2322 W Hobbs Dr, South Jordan, UT 84095 and is currently estimated at $848,276, approximately $206 per square foot. 2322 W Hobbs Dr is a home located in Salt Lake County with nearby schools including Jordan Ridge School, South Jordan Middle School, and Hawthorn Academy.
Ownership History
Date
Name
Owned For
Owner Type
Purchase Details
Closed on
May 12, 2020
Sold by
Baker Thomas and Baker Janice
Bought by
Baker Thomas Ray and Baker Janice Halvorsen
Current Estimated Value
Home Financials for this Owner
Home Financials are based on the most recent Mortgage that was taken out on this home.
Original Mortgage
$226,600
Outstanding Balance
$200,799
Interest Rate
3.3%
Mortgage Type
New Conventional
Estimated Equity
$647,477
Purchase Details
Closed on
Jun 30, 2017
Sold by
Baker Thoams R and Baker Janice H
Bought by
Baker Thoams Ray and Baker Janice Halvorsen
Purchase Details
Closed on
Sep 29, 2009
Sold by
Hunsaker Raymond Dee and Hunsaker Dianne
Bought by
Baker Thomas R and Baker Janice H
Home Financials for this Owner
Home Financials are based on the most recent Mortgage that was taken out on this home.
Original Mortgage
$274,800
Interest Rate
5.08%
Mortgage Type
New Conventional
Create a Home Valuation Report for This Property
The Home Valuation Report is an in-depth analysis detailing your home's value as well as a comparison with similar homes in the area
Home Values in the Area
Average Home Value in this Area
Purchase History
| Date | Buyer | Sale Price | Title Company |
|---|---|---|---|
| Baker Thomas Ray | -- | Integrated Title Ins Svcs | |
| Baker Thomas | -- | Integrated Title Ins Svcs | |
| Baker Thoams Ray | -- | None Available | |
| Baker Thomas R | -- | Equity Title |
Source: Public Records
Mortgage History
| Date | Status | Borrower | Loan Amount |
|---|---|---|---|
| Open | Baker Thomas | $226,600 | |
| Closed | Baker Thomas R | $274,800 |
Source: Public Records
Tax History Compared to Growth
Tax History
| Year | Tax Paid | Tax Assessment Tax Assessment Total Assessment is a certain percentage of the fair market value that is determined by local assessors to be the total taxable value of land and additions on the property. | Land | Improvement |
|---|---|---|---|---|
| 2025 | $4,064 | $845,100 | $328,800 | $516,300 |
| 2024 | $4,064 | $771,600 | $307,400 | $464,200 |
| 2023 | $4,134 | $740,600 | $301,400 | $439,200 |
| 2022 | $4,326 | $759,600 | $295,500 | $464,100 |
| 2021 | $3,619 | $583,000 | $242,300 | $340,700 |
| 2020 | $3,390 | $512,000 | $226,900 | $285,100 |
| 2019 | $3,288 | $488,000 | $226,900 | $261,100 |
| 2018 | $3,089 | $456,200 | $142,700 | $313,500 |
| 2017 | $2,971 | $430,000 | $142,700 | $287,300 |
| 2016 | $2,928 | $401,600 | $142,700 | $258,900 |
| 2015 | $2,905 | $387,400 | $156,300 | $231,100 |
| 2014 | $2,717 | $356,100 | $145,400 | $210,700 |
Source: Public Records
Map
Nearby Homes
- 2097 Jordan Villa Dr
- 2246 Country Bend Dr Unit 25
- 9414 S 1980 W
- 9496 S 1930 W
- 2116 W Abbey View Rd
- 2177 W 9240 S
- 2551 W Winding Way
- 9252 S 2040 W Unit D
- 2223 W Williamsburg Cir
- 1967 W 9350 S
- 2286 Williamsburg Cir
- 9294 S 2700 W
- 1968 W 9270 S Unit C
- 9178 Lisa Ave
- 2439 Bridle Oak Dr
- 1753 Rylie Ann Cir
- 1788 W Ikaros Ln
- 1741 W Nikos Ln
- 1767 W Ikaros Ln
- 9511 S Tirado Cove Unit 204
- 2322 Hobbs Dr
- 2346 Hobbs Dr
- 2296 Hobbs Dr
- 2324 Hobbs Dr
- 2341 Hobbs Dr
- 2366 Hobbs Dr
- 2291 Hobbs Dr
- 2276 Hobbs Dr
- 2359 Hobbs Dr
- 2386 Hobbs Dr
- 2375 Hobbs Dr
- 2375 W Hobbs Dr
- 9605 Providence Way
- 9605 S Providence Way
- 2324 Providence Cir
- 9541 S 2200 W
- 2350 Providence Cir
- 2256 W Hobbs Dr
- 2256 Hobbs Dr
- 2265 W Hobbs Dr