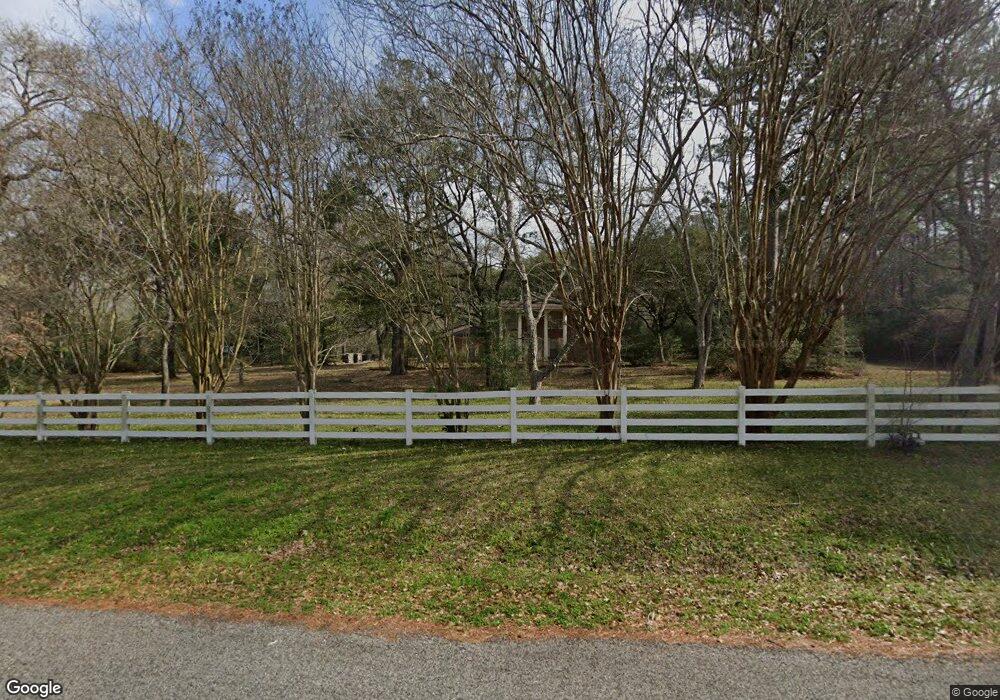
23222 Cardinal Dr Hockley, TX 77447
Estimated Value: $597,000 - $797,000
5
Beds
4
Baths
3,778
Sq Ft
$186/Sq Ft
Est. Value
About This Home
This home is located at 23222 Cardinal Dr, Hockley, TX 77447 and is currently estimated at $701,836, approximately $185 per square foot. 23222 Cardinal Dr is a home located in Harris County with nearby schools including Evelyn Turlington Elementary School, Schultz Junior High School, and Waller High School.
Create a Home Valuation Report for This Property
The Home Valuation Report is an in-depth analysis detailing your home's value as well as a comparison with similar homes in the area
Home Values in the Area
Average Home Value in this Area
Tax History Compared to Growth
Tax History
| Year | Tax Paid | Tax Assessment Tax Assessment Total Assessment is a certain percentage of the fair market value that is determined by local assessors to be the total taxable value of land and additions on the property. | Land | Improvement |
|---|---|---|---|---|
| 2025 | $2,288 | $704,439 | $226,020 | $478,419 |
| 2024 | $2,288 | $694,558 | $226,020 | $468,538 |
| 2023 | $2,047 | $654,845 | $150,680 | $504,165 |
| 2022 | $10,375 | $597,985 | $150,680 | $447,305 |
| 2021 | $9,783 | $464,628 | $150,680 | $313,948 |
| 2020 | $10,160 | $464,628 | $150,680 | $313,948 |
| 2019 | $9,717 | $485,121 | $113,010 | $372,111 |
| 2018 | $1,728 | $388,251 | $82,874 | $305,377 |
| 2017 | $8,678 | $388,251 | $82,874 | $305,377 |
| 2016 | $8,347 | $388,251 | $82,874 | $305,377 |
| 2015 | $885 | $388,251 | $82,874 | $305,377 |
| 2014 | $885 | $308,623 | $75,340 | $233,283 |
Source: Public Records
Map
Nearby Homes
- 23114 Cardinal Dr
- 22327 Three Pines Dr
- 20306 Courageous Dr
- 22019 Robins Rd
- 23515 Cardinal Dr
- 21815 Fearless Dr
- 21334 Farm To Market Road 2920
- TBD Farm To Market Road 2920
- 20719 New Kentucky Village Dr
- 22914 Three Pines Dr
- 21010 Red Arbutus Ct
- 21310 Barcelona Heights Trail
- 20910 Holm Oak Way
- 0 Roberts Cemetery Rd Unit 36689208
- 21843 Carballo Oak Trail
- 21701 Glenmont Blvd
- 0 Prop Id 101208 Unit 35069205
- 21914 Hibiscus Hedge Trail
- 21410 Villa Spruce Ln
- 21006 Yellow Ipe Grove Ct
- 23254 Cardinal Dr
- 23256 Cardinal Dr
- 20818 Pine Oak Ln
- 20818 Rose Ln
- 22715 Cardinal Dr
- 22503 Cardinal Dr
- 22821 Cardinal Dr
- 22615 Cardinal Dr
- 22614 Cardinal Dr
- 20815 Pine Oak Ln
- 20810 Rose Ln
- 20810 Pine Oak Ln
- 22827 Cardinal Dr
- 22610 Cardinal Dr
- 23006 Cardinal Dr
- 20815 Rose Ln
- 22829 Cardinal Dr
- 23003 Cardinal Dr
- 22435 Pine Tree Ln
- 20802 Pine Tree Ln