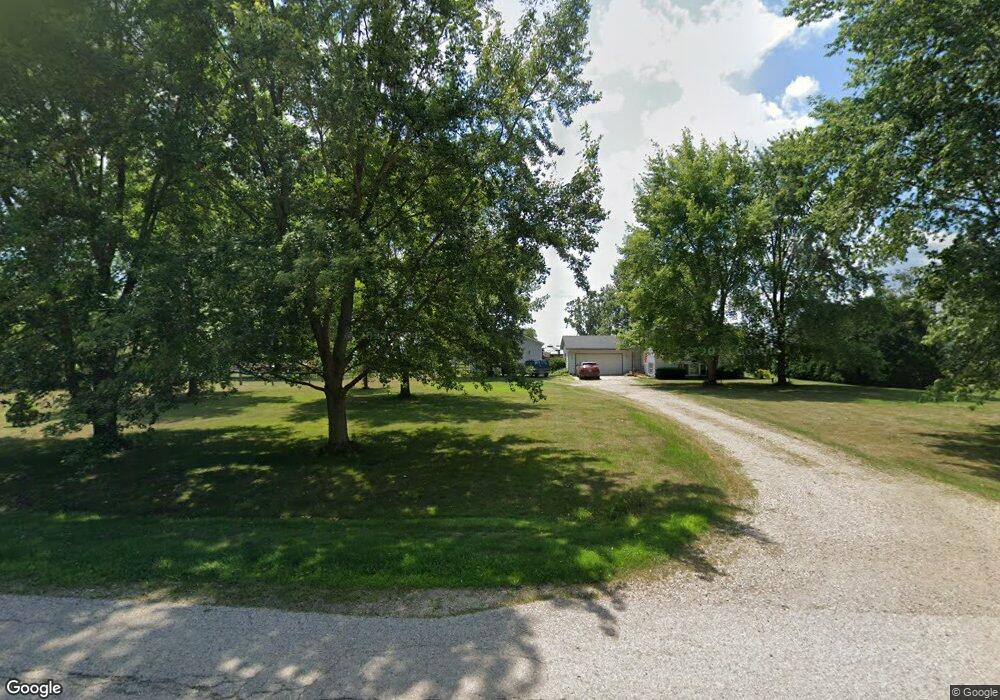
23229 Graf Rd Harvard, IL 60033
Estimated Value: $250,898 - $295,000
Studio
--
Bath
--
Sq Ft
70,524
Sq Ft Lot
About This Home
This home is located at 23229 Graf Rd, Harvard, IL 60033 and is currently estimated at $266,725. 23229 Graf Rd is a home located in McHenry County with nearby schools including Jefferson Elementary School, Crosby Elementary School, and Harvard Junior High School.
Ownership History
Date
Name
Owned For
Owner Type
Purchase Details
Closed on
Mar 24, 2022
Sold by
Donald Wilkening
Bought by
Donald Wilkening Revocable Trust
Current Estimated Value
Purchase Details
Closed on
Mar 6, 2001
Sold by
Wilkening Clarence H
Bought by
Wilkening Donald
Home Financials for this Owner
Home Financials are based on the most recent Mortgage that was taken out on this home.
Original Mortgage
$130,000
Interest Rate
7.03%
Mortgage Type
Seller Take Back
Purchase Details
Closed on
Nov 15, 1999
Sold by
Wilkening Clarence H
Bought by
Wilkening Clarence H
Purchase Details
Closed on
Mar 20, 1997
Sold by
Wilkening Donald and Wilkening Kathleen J
Bought by
Wilkening Clarence H
Purchase Details
Closed on
Feb 11, 1994
Sold by
Melson Larry D and Melson Susan E
Bought by
Wilkening Donald and Wilkening Kathleen J
Home Financials for this Owner
Home Financials are based on the most recent Mortgage that was taken out on this home.
Original Mortgage
$113,550
Interest Rate
7.22%
Create a Home Valuation Report for This Property
The Home Valuation Report is an in-depth analysis detailing your home's value as well as a comparison with similar homes in the area
Home Values in the Area
Average Home Value in this Area
Purchase History
| Date | Buyer | Sale Price | Title Company |
|---|---|---|---|
| Donald Wilkening Revocable Trust | -- | None Listed On Document | |
| Wilkening Donald | $130,000 | -- | |
| Wilkening Clarence H | -- | -- | |
| Wilkening Clarence H | $125,500 | -- | |
| Wilkening Donald | $133,000 | -- |
Source: Public Records
Mortgage History
| Date | Status | Borrower | Loan Amount |
|---|---|---|---|
| Previous Owner | Wilkening Donald | $130,000 | |
| Previous Owner | Wilkening Donald | $113,550 |
Source: Public Records
Tax History
| Year | Tax Paid | Tax Assessment Tax Assessment Total Assessment is a certain percentage of the fair market value that is determined by local assessors to be the total taxable value of land and additions on the property. | Land | Improvement |
|---|---|---|---|---|
| 2024 | $3,636 | $67,704 | $9,178 | $58,526 |
| 2023 | $3,466 | $61,204 | $8,297 | $52,907 |
| 2022 | $3,292 | $52,383 | $8,297 | $44,086 |
| 2021 | $3,102 | $48,783 | $7,727 | $41,056 |
| 2020 | $2,748 | $46,442 | $7,356 | $39,086 |
| 2019 | $2,799 | $43,461 | $6,884 | $36,577 |
| 2018 | $3,655 | $46,521 | $6,885 | $39,636 |
| 2017 | $3,464 | $41,914 | $6,203 | $35,711 |
| 2016 | $3,313 | $39,564 | $5,855 | $33,709 |
| 2013 | -- | $39,626 | $5,864 | $33,762 |
Source: Public Records
Map
Nearby Homes
- 0 Oak Grove Rd Unit MRD11827728
- 7208 White Oaks Rd
- 715 Apple Valley Rd
- 1511 6th St
- 1507 6th St
- 1518 Sage Ln
- 1503 W Diggins St
- 23816 Illinois 173
- 607 W Burbank St
- 6018 Hickory St
- 403 W Washington St
- 0000 N Division St
- 41.94 Acres US Highway 14
- 0 Us Highway 14
- 203 W Brown St
- 00 Nilsen Ct
- 106 W Thompson St
- 20519 Illinois 173
- 17905 Illinois 173
- 703 Lincoln St
Your Personal Tour Guide
Ask me questions while you tour the home.