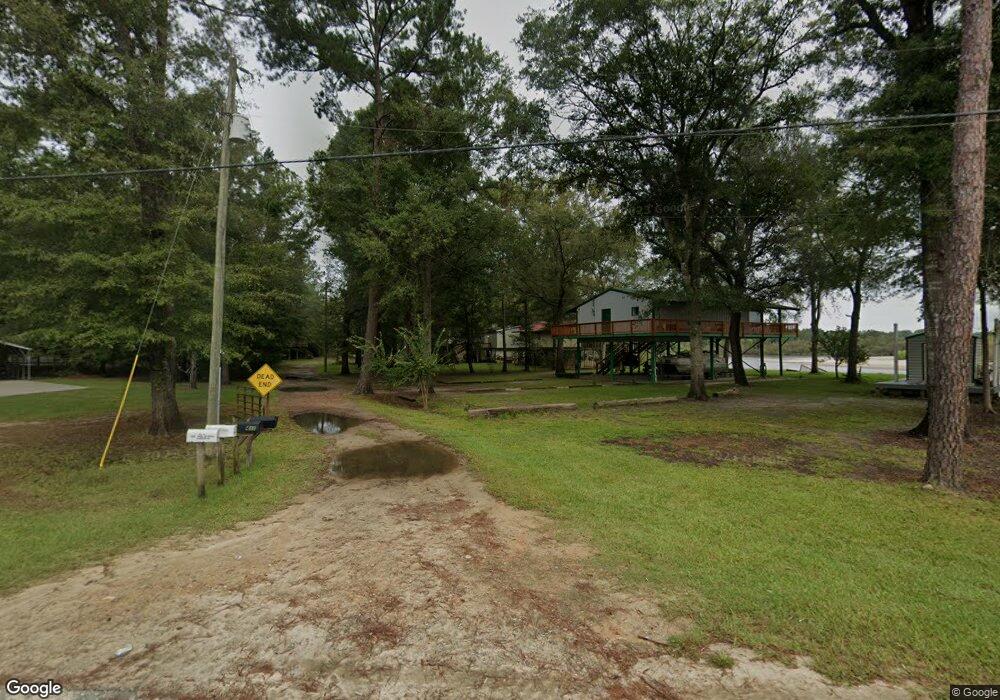
2323 Carter Bight Landing Rd Surrency, GA 31563
Estimated Value: $163,000 - $233,000
--
Bed
1
Bath
1,050
Sq Ft
$184/Sq Ft
Est. Value
About This Home
This home is located at 2323 Carter Bight Landing Rd, Surrency, GA 31563 and is currently estimated at $193,485, approximately $184 per square foot. 2323 Carter Bight Landing Rd is a home located in Appling County.
Ownership History
Date
Name
Owned For
Owner Type
Purchase Details
Closed on
Jul 26, 2013
Sold by
Dieveney James F
Bought by
Jones Bradley T and Jones Kathy M
Current Estimated Value
Purchase Details
Closed on
Aug 4, 2005
Sold by
Johnson Robert
Bought by
Jones Bradley T and Jones Kathy M
Purchase Details
Closed on
Apr 29, 2002
Bought by
Johnson Robert
Purchase Details
Closed on
Jul 2, 1999
Bought by
Johnson Robert
Create a Home Valuation Report for This Property
The Home Valuation Report is an in-depth analysis detailing your home's value as well as a comparison with similar homes in the area
Home Values in the Area
Average Home Value in this Area
Purchase History
| Date | Buyer | Sale Price | Title Company |
|---|---|---|---|
| Jones Bradley T | $103,100 | -- | |
| Jones Bradley T | $103,042 | -- | |
| Jones Bradley T | $125,000 | -- | |
| Johnson Robert | -- | -- | |
| Johnson Robert | $24,000 | -- |
Source: Public Records
Tax History Compared to Growth
Tax History
| Year | Tax Paid | Tax Assessment Tax Assessment Total Assessment is a certain percentage of the fair market value that is determined by local assessors to be the total taxable value of land and additions on the property. | Land | Improvement |
|---|---|---|---|---|
| 2024 | $1,165 | $47,440 | $17,760 | $29,680 |
| 2023 | $1,165 | $47,440 | $17,760 | $29,680 |
| 2022 | $1,263 | $48,928 | $17,760 | $31,168 |
| 2021 | $1,264 | $48,928 | $17,760 | $31,168 |
| 2020 | $1,312 | $48,928 | $17,760 | $31,168 |
| 2019 | $1,338 | $48,928 | $17,760 | $31,168 |
| 2018 | $1,362 | $48,928 | $17,760 | $31,168 |
| 2017 | $1,362 | $48,928 | $17,760 | $31,168 |
| 2016 | $1,362 | $48,928 | $17,760 | $31,168 |
| 2015 | $1,365 | $48,928 | $17,760 | $31,168 |
| 2014 | $1,367 | $48,928 | $17,760 | $31,168 |
| 2013 | -- | $48,928 | $17,760 | $31,168 |
Source: Public Records
Map
Nearby Homes
- 2262 Carter Bight Landing Rd
- 2264 Carter Bight Landing Rd
- 145 Getaway Ln
- 315 Getaway Ln
- 0 Lee Woods Rd Unit 18062646
- 0 Lee Woods Rd Unit 11355226
- 9027 Georgia 144
- 963 Oak Grove Rd
- 1014 Jiggs Harden Rd
- 189 High Bluff Rd
- 163 High Bluff Rd
- 1758 Eason Bluff Rd
- 1758 Easons Bluff Rd
- 965 Oquinn Loop
- 46 Georgia 178
- 0 Oquinn Loop
- Tbd Baxter Durrence Rd
- Tbd Baxter Durrence Rd
- 9027 Ga Highway 144 NE
- Tbd Baxter Durrence Rd
- 2347 Carter Bight Landing Rd
- 2347 Carter Bite
- 2363 Carter Bight Landing Rd
- 2286 Carter Bight Landing Rd
- 0 River Loop Rd Unit 29902
- 0 River Loop Rd Unit 29496
- 0 River Loop Rd Unit 28663
- 0 River Loop Rd Unit 28125
- 0 River Loop Rd Unit 8741944
- 0 River Loop Rd Unit 8848681
- 105 River Loop Rd
- 474 River Loop Rd
- 73 Getaway Ln
- 206 River Loop Rd
- 2260 Carter Bight Landing Rd
- 245 River Loop Rd
- 68 Getaway Ln
- 103 Getaway Ln
- 1115 Getaway Ln
- 2163 Carter Bight Landing Rd