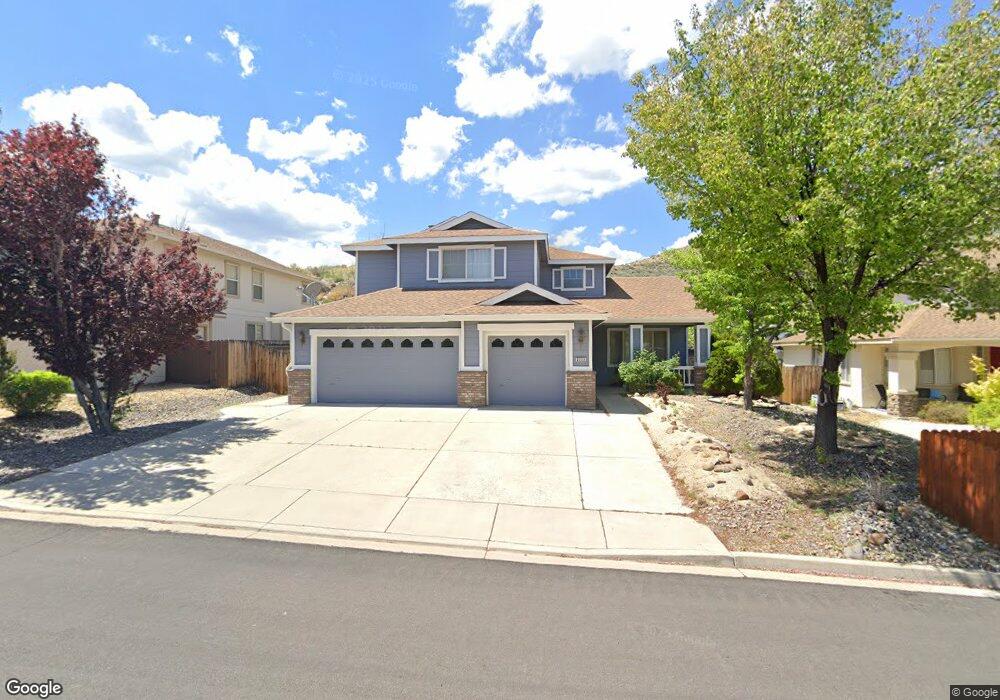
2323 Red Maple Ct Reno, NV 89523
Northgate NeighborhoodEstimated Value: $728,000 - $771,000
4
Beds
3
Baths
2,509
Sq Ft
$298/Sq Ft
Est. Value
About This Home
This home is located at 2323 Red Maple Ct, Reno, NV 89523 and is currently estimated at $746,718, approximately $297 per square foot. 2323 Red Maple Ct is a home located in Washoe County with nearby schools including Rollan D. Melton Elementary School, B D Billinghurst Middle School, and Robert McQueen High School.
Ownership History
Date
Name
Owned For
Owner Type
Purchase Details
Closed on
Jun 14, 2022
Sold by
Tracey Chau
Bought by
Tracey Chau Family Trust
Current Estimated Value
Purchase Details
Closed on
Oct 22, 2010
Sold by
Chau Hoa D and Chau Tracey
Bought by
Chau Tracey
Home Financials for this Owner
Home Financials are based on the most recent Mortgage that was taken out on this home.
Original Mortgage
$175,500
Interest Rate
4.33%
Mortgage Type
New Conventional
Purchase Details
Closed on
Mar 6, 2002
Sold by
Bailey and Bailey Dutton
Bought by
Chau Hoa D and Chau Tracey
Home Financials for this Owner
Home Financials are based on the most recent Mortgage that was taken out on this home.
Original Mortgage
$186,087
Interest Rate
6.94%
Create a Home Valuation Report for This Property
The Home Valuation Report is an in-depth analysis detailing your home's value as well as a comparison with similar homes in the area
Home Values in the Area
Average Home Value in this Area
Purchase History
| Date | Buyer | Sale Price | Title Company |
|---|---|---|---|
| Tracey Chau Family Trust | -- | Law Office Of Scott N Tisevich | |
| Chau Tracey | -- | Ticor Title Reno | |
| Chau Hoa D | $232,609 | Stewart Title Northern Nevad |
Source: Public Records
Mortgage History
| Date | Status | Borrower | Loan Amount |
|---|---|---|---|
| Previous Owner | Chau Tracey | $175,500 | |
| Previous Owner | Chau Hoa D | $186,087 |
Source: Public Records
Tax History Compared to Growth
Tax History
| Year | Tax Paid | Tax Assessment Tax Assessment Total Assessment is a certain percentage of the fair market value that is determined by local assessors to be the total taxable value of land and additions on the property. | Land | Improvement |
|---|---|---|---|---|
| 2025 | $3,819 | $153,360 | $43,575 | $109,785 |
| 2024 | $3,819 | $146,366 | $35,735 | $110,632 |
| 2023 | $2,695 | $144,330 | $39,585 | $104,745 |
| 2022 | $3,600 | $120,832 | $33,565 | $87,267 |
| 2021 | $3,495 | $113,556 | $26,775 | $86,781 |
| 2020 | $3,392 | $113,750 | $26,810 | $86,940 |
| 2019 | $3,293 | $111,693 | $26,810 | $84,883 |
| 2018 | $3,156 | $101,669 | $19,775 | $81,894 |
| 2017 | $3,064 | $100,480 | $18,515 | $81,965 |
| 2016 | $2,987 | $101,246 | $17,605 | $83,641 |
| 2015 | $2,983 | $98,365 | $15,015 | $83,350 |
| 2014 | $2,896 | $93,084 | $12,950 | $80,134 |
| 2013 | -- | $80,186 | $9,695 | $70,491 |
Source: Public Records
Map
Nearby Homes
- 2365 Red Maple Ct
- 2163 3 Wood Ln
- 2014 Cradle Mountain Dr Unit 2
- 1836 Cambridge Hills Ct
- 2730 Avenida de Landa
- 6460 Valley Wood Dr
- 6368 Springwood Dr
- 2605 Snow Partridge Dr
- 2580 Snow Partridge Dr
- 6811 Sonterra Ln
- 1664 Shadow Wood Rd
- 1651 Ashbury Ln
- 2971 Fox Trail Dr
- 1055 Udowski Unit Homesite 53
- 1025 Udowski Unit Homesite 56
- 0 Unit 250003854
- 6220 Valley Wood Dr
- 2350 Glen Eagles Dr
- 2273 Sapphire Ridge Way
- 1750 Polo Park Dr
- 2329 Red Maple Ct
- 2317 Red Maple Ct
- 2335 Red Maple Ct
- 2330 Red Maple Ct
- 2324 Red Maple Ct
- 2341 Red Maple Ct Unit 21
- 2341 Red Maple Ct Unit Reno
- 2336 Red Maple Ct
- 2318 Red Maple Ct
- 2342 Red Maple Ct
- 2312 Red Maple Ct
- 2347 Red Maple Ct
- 2348 Red Maple Ct
- 2300 Red Maple Ct
- 2306 Red Maple Ct
- 2353 Red Maple Ct
- 2354 Red Maple Ct
- 2359 Red Maple Ct
- 6620 Claymont Ct
- 2360 Red Maple Ct