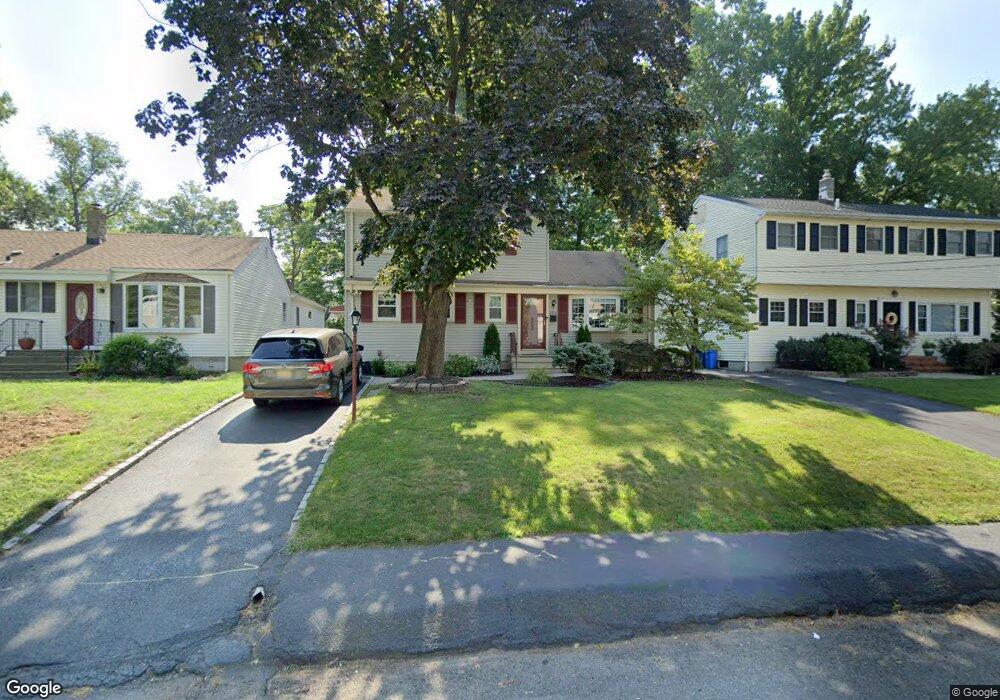
2324 Evergreen Ave Scotch Plains, NJ 07076
Estimated Value: $436,818 - $792,000
--
Bed
--
Bath
1,944
Sq Ft
$350/Sq Ft
Est. Value
About This Home
This home is located at 2324 Evergreen Ave, Scotch Plains, NJ 07076 and is currently estimated at $681,205, approximately $350 per square foot. 2324 Evergreen Ave is a home located in Union County with nearby schools including Evergreen Elementary School, Nettingham Middle School, and Scotch Plains-Fanwood High School.
Ownership History
Date
Name
Owned For
Owner Type
Purchase Details
Closed on
Jul 16, 2007
Sold by
Szarvas Barry W and Szarvas Karen
Bought by
Palian Charles A and Palian Erin L
Current Estimated Value
Home Financials for this Owner
Home Financials are based on the most recent Mortgage that was taken out on this home.
Original Mortgage
$384,800
Outstanding Balance
$241,015
Interest Rate
6.54%
Mortgage Type
Purchase Money Mortgage
Estimated Equity
$440,190
Purchase Details
Closed on
Jul 17, 1997
Sold by
Baudistel Claire Virginia
Bought by
Burns Jeffrey W and Burns Laura
Home Financials for this Owner
Home Financials are based on the most recent Mortgage that was taken out on this home.
Original Mortgage
$142,000
Interest Rate
7.55%
Create a Home Valuation Report for This Property
The Home Valuation Report is an in-depth analysis detailing your home's value as well as a comparison with similar homes in the area
Home Values in the Area
Average Home Value in this Area
Purchase History
| Date | Buyer | Sale Price | Title Company |
|---|---|---|---|
| Palian Charles A | $481,000 | Stewart Title Guaranty Compa | |
| Burns Jeffrey W | $183,000 | -- |
Source: Public Records
Mortgage History
| Date | Status | Borrower | Loan Amount |
|---|---|---|---|
| Open | Palian Charles A | $384,800 | |
| Previous Owner | Burns Jeffrey W | $142,000 |
Source: Public Records
Tax History Compared to Growth
Tax History
| Year | Tax Paid | Tax Assessment Tax Assessment Total Assessment is a certain percentage of the fair market value that is determined by local assessors to be the total taxable value of land and additions on the property. | Land | Improvement |
|---|---|---|---|---|
| 2025 | $11,486 | $131,400 | $30,200 | $101,200 |
| 2024 | $11,147 | $97,600 | $30,200 | $67,400 |
| 2023 | $11,147 | $97,600 | $30,200 | $67,400 |
| 2022 | $10,653 | $94,400 | $30,200 | $64,200 |
| 2021 | $10,635 | $94,400 | $30,200 | $64,200 |
| 2020 | $10,584 | $94,400 | $30,200 | $64,200 |
| 2019 | $10,506 | $94,400 | $30,200 | $64,200 |
| 2018 | $10,329 | $94,400 | $30,200 | $64,200 |
| 2017 | $10,100 | $94,400 | $30,200 | $64,200 |
| 2016 | $9,905 | $94,400 | $30,200 | $64,200 |
| 2015 | $9,743 | $94,400 | $30,200 | $64,200 |
| 2014 | $9,422 | $94,400 | $30,200 | $64,200 |
Source: Public Records
Map
Nearby Homes
- 524 William St
- 2323 Belvedere Dr
- 7 Riga Ct
- 545 Westfield Rd
- 16 Riga Ct Unit 2B
- 26 Riga Ct Unit 3A
- 417 Victor St
- 2269 Redwood Rd
- 24 Deborah Way
- 327 Jerusalem Rd
- 2430 Mountain Ave
- 177 Pleasant Ave
- 217 William St
- 414 Roberts Ln
- 2398 Hamlette Place
- 215 Katherine St
- 2085 Nicholl Ave
- 360 Cook Ave
- 4 Lois Place
- 2588 Liberty Ave
- 2320 Evergreen Ave
- 2328 Evergreen Ave
- 555 Cedar St
- 561 Cedar St
- 2327 Monica Place
- 2319 Monica Place
- 2335 Monica Place
- 2311 Monica Place
- 545 Cedar St
- 2329 Evergreen Ave
- 2321 Evergreen Ave
- 2343 Monica Place
- 2333 Evergreen Ave
- 2326 Monica Place
- 2318 Monica Place
- 539 Cedar St
- 2334 Monica Place
- 2351 Monica Place
- 2348 Westfield Ave
- 544 Cedar St