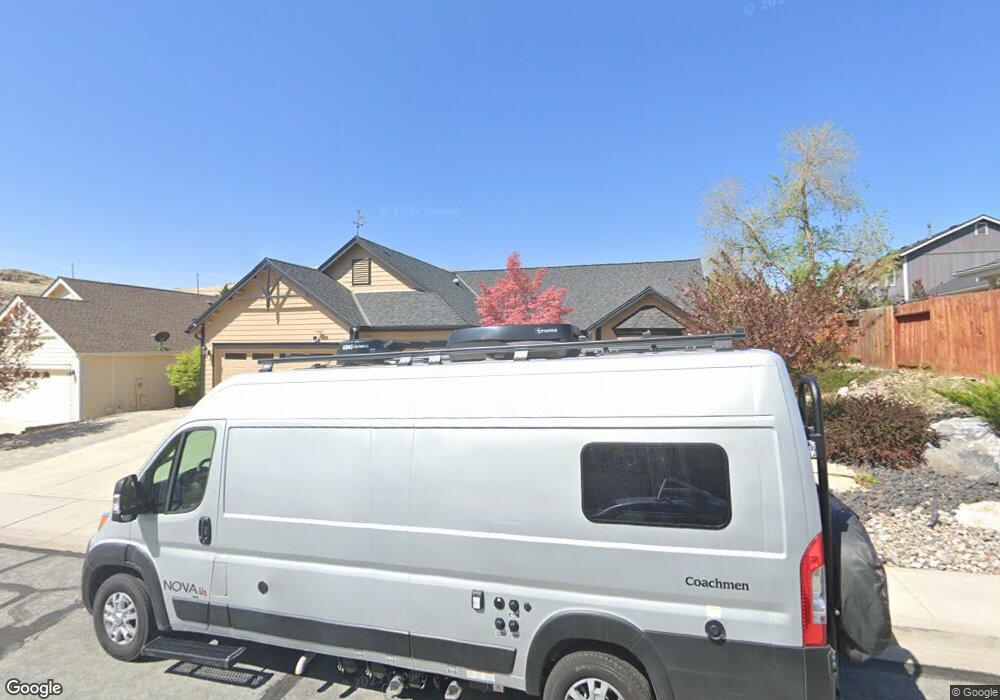
2324 Libero Dr Sparks, NV 89436
Reed NeighborhoodEstimated Value: $575,000 - $606,947
4
Beds
2
Baths
2,059
Sq Ft
$287/Sq Ft
Est. Value
About This Home
This home is located at 2324 Libero Dr, Sparks, NV 89436 and is currently estimated at $590,987, approximately $287 per square foot. 2324 Libero Dr is a home located in Washoe County with nearby schools including Hershal H. Beam Elementary School, Lena Juniper Elementary School, and Lou Mendive Middle School.
Ownership History
Date
Name
Owned For
Owner Type
Purchase Details
Closed on
Dec 21, 2004
Sold by
Madden Michael P and Madden Arlene M
Bought by
Madden Michael P and Madden Arlene M
Current Estimated Value
Purchase Details
Closed on
May 7, 2001
Sold by
Daniel Michael S and Daniel Eileen M
Bought by
Madden Michael and Madden Arlene
Home Financials for this Owner
Home Financials are based on the most recent Mortgage that was taken out on this home.
Original Mortgage
$167,200
Outstanding Balance
$61,785
Interest Rate
6.89%
Estimated Equity
$529,202
Purchase Details
Closed on
Jul 9, 1996
Sold by
Saddleback Associates
Bought by
Daniel Michael S and Daniel Eileen M
Home Financials for this Owner
Home Financials are based on the most recent Mortgage that was taken out on this home.
Original Mortgage
$195,533
Interest Rate
3.87%
Create a Home Valuation Report for This Property
The Home Valuation Report is an in-depth analysis detailing your home's value as well as a comparison with similar homes in the area
Home Values in the Area
Average Home Value in this Area
Purchase History
| Date | Buyer | Sale Price | Title Company |
|---|---|---|---|
| Madden Michael P | -- | -- | |
| Madden Michael | $209,000 | Founders Title Co | |
| Daniel Michael S | $206,000 | Founders Title Co |
Source: Public Records
Mortgage History
| Date | Status | Borrower | Loan Amount |
|---|---|---|---|
| Open | Madden Michael | $167,200 | |
| Previous Owner | Daniel Michael S | $195,533 |
Source: Public Records
Tax History Compared to Growth
Tax History
| Year | Tax Paid | Tax Assessment Tax Assessment Total Assessment is a certain percentage of the fair market value that is determined by local assessors to be the total taxable value of land and additions on the property. | Land | Improvement |
|---|---|---|---|---|
| 2025 | $1,813 | $129,338 | $45,605 | $83,733 |
| 2024 | $1,703 | $123,126 | $40,145 | $82,982 |
| 2023 | $1,703 | $122,046 | $43,120 | $78,926 |
| 2022 | $1,714 | $97,796 | $31,815 | $65,981 |
| 2021 | $1,692 | $90,929 | $25,130 | $65,799 |
| 2020 | $1,626 | $91,235 | $25,130 | $66,105 |
| 2019 | $2,088 | $89,407 | $24,360 | $65,047 |
| 2018 | $2,028 | $81,573 | $17,815 | $63,758 |
| 2017 | $1,969 | $81,748 | $17,710 | $64,038 |
| 2016 | $2,389 | $82,349 | $18,235 | $64,114 |
| 2015 | $2,386 | $79,088 | $14,805 | $64,283 |
| 2014 | $2,283 | $73,243 | $11,795 | $61,448 |
| 2013 | -- | $60,826 | $9,695 | $51,131 |
Source: Public Records
Map
Nearby Homes
- 1031 Vintage Hills Pkwy
- 3602 Oakridge Dr
- 3988 Ella Jayne Ct Unit Lot 6
- 3595 Rocky Ridge Ct
- 510 S Sand Crane Cir
- 519 N Sand Crane Cir
- 930 Spanish Springs Rd
- Plan 4 at Eagle Peak
- Plan 5 at Eagle Peak
- Plan 2 at Eagle Peak
- Plan 1 at Eagle Peak
- Plan 3 at Eagle Peak
- 1069 Palmwood Dr
- 4719 Wood Thrush Ln
- 4515 Whitney Cir
- 3200 Bristle Branch Dr
- 3198 Bristle Branch Dr
- 3188 Bristle Branch Dr
- 4739 Wood Thrush Ln
- 3167 Bristle Branch Dr
- 2334 Libero Dr
- 795 Francesca Way
- 755 Francesca Way Unit 3
- 2342 Libero Dr
- 2325 Libero Dr
- 815 Francesca Way
- 2346 Libero Dr
- 2345 Libero Dr
- 796 Francesca Way
- 2485 Rio Alayne Ct
- 829 Francesca Way
- 756 Francesca Way
- 2465 Rio Alayne Ct
- 2475 Rio Alayne Ct
- 820 Francesca Way
- 2495 Rio Alayne Ct Unit 3
- 839 Francesca Way
- 2525 Rio Alayne Ct
- 2354 Libero Dr
- 2365 Libero Dr