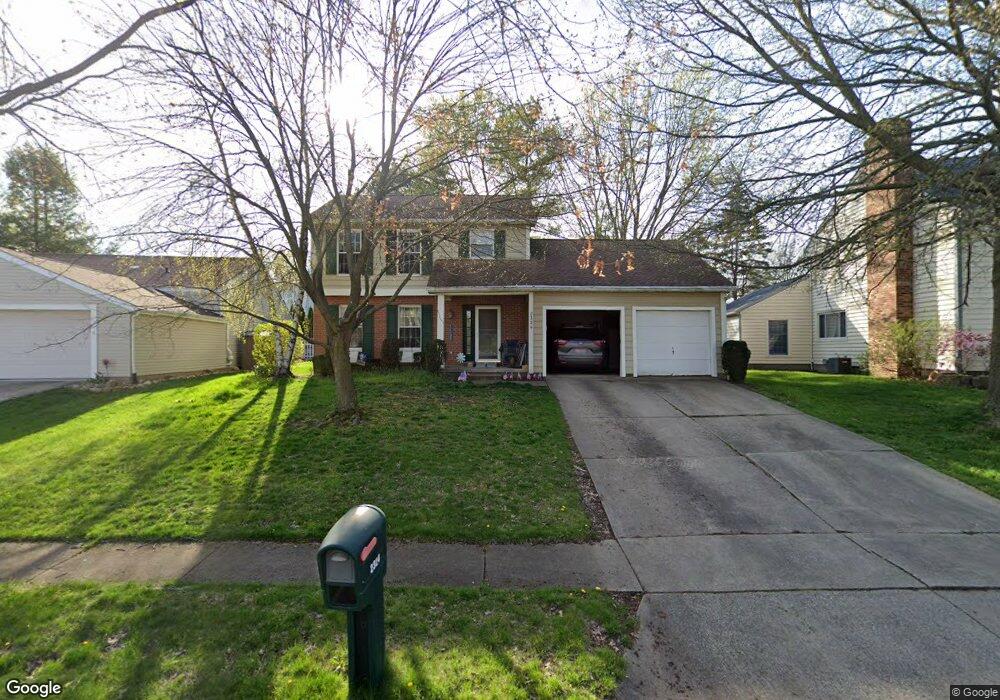
2324 Providence Blvd Cuyahoga Falls, OH 44221
Heslop Morningview NeighborhoodEstimated Value: $233,000 - $280,000
3
Beds
3
Baths
1,448
Sq Ft
$183/Sq Ft
Est. Value
About This Home
This home is located at 2324 Providence Blvd, Cuyahoga Falls, OH 44221 and is currently estimated at $265,683, approximately $183 per square foot. 2324 Providence Blvd is a home located in Summit County with nearby schools including Elizabeth Price Elementary School, Roberts Middle School, and Cuyahoga Falls High School.
Ownership History
Date
Name
Owned For
Owner Type
Purchase Details
Closed on
Jun 14, 1999
Sold by
Mierau Michael D and Mierau Jill E
Bought by
Sawyer Scott D and Sawyer Kathleen N
Current Estimated Value
Home Financials for this Owner
Home Financials are based on the most recent Mortgage that was taken out on this home.
Original Mortgage
$142,500
Outstanding Balance
$37,396
Interest Rate
6.99%
Estimated Equity
$228,287
Purchase Details
Closed on
Aug 11, 1995
Sold by
Shoemaker Steven
Bought by
Mierau Michael D and Mierau Jill E
Home Financials for this Owner
Home Financials are based on the most recent Mortgage that was taken out on this home.
Original Mortgage
$132,600
Interest Rate
7.51%
Mortgage Type
VA
Purchase Details
Closed on
Sep 19, 1994
Sold by
Luth James W
Bought by
Shoemaker Steven G
Home Financials for this Owner
Home Financials are based on the most recent Mortgage that was taken out on this home.
Original Mortgage
$117,000
Interest Rate
6.37%
Mortgage Type
New Conventional
Create a Home Valuation Report for This Property
The Home Valuation Report is an in-depth analysis detailing your home's value as well as a comparison with similar homes in the area
Home Values in the Area
Average Home Value in this Area
Purchase History
| Date | Buyer | Sale Price | Title Company |
|---|---|---|---|
| Sawyer Scott D | $150,000 | Midland Commerce Group | |
| Mierau Michael D | $132,600 | -- | |
| Shoemaker Steven G | $130,000 | -- |
Source: Public Records
Mortgage History
| Date | Status | Borrower | Loan Amount |
|---|---|---|---|
| Open | Sawyer Scott D | $142,500 | |
| Previous Owner | Mierau Michael D | $132,600 | |
| Previous Owner | Shoemaker Steven G | $117,000 |
Source: Public Records
Tax History Compared to Growth
Tax History
| Year | Tax Paid | Tax Assessment Tax Assessment Total Assessment is a certain percentage of the fair market value that is determined by local assessors to be the total taxable value of land and additions on the property. | Land | Improvement |
|---|---|---|---|---|
| 2025 | $3,973 | $71,950 | $13,258 | $58,692 |
| 2024 | $3,973 | $71,950 | $13,258 | $58,692 |
| 2023 | $3,973 | $71,950 | $13,258 | $58,692 |
| 2022 | $4,183 | $61,566 | $11,330 | $50,236 |
| 2021 | $4,183 | $61,566 | $11,330 | $50,236 |
| 2020 | $4,116 | $61,570 | $11,330 | $50,240 |
| 2019 | $3,805 | $51,850 | $11,330 | $40,520 |
| 2018 | $3,244 | $51,850 | $11,330 | $40,520 |
| 2017 | $2,923 | $51,850 | $11,330 | $40,520 |
| 2016 | $2,925 | $47,250 | $11,330 | $35,920 |
| 2015 | $2,923 | $47,250 | $11,330 | $35,920 |
| 2014 | $2,924 | $47,250 | $11,330 | $35,920 |
| 2013 | $2,893 | $47,150 | $11,330 | $35,820 |
Source: Public Records
Map
Nearby Homes
- 2375 Plymouth Ln
- 2183 Plymouth Ln
- 2300 Larchdale Dr
- 1473 Munroe Falls Ave Unit 5
- 1521 Anderson Rd
- 2100 Delmore St
- 1219 Curtis Ave
- 1921 Dwight St
- 2289 Bailey Rd
- 70 Richard Dr
- 2604 Hawthorne Rd
- 2610 Hawthorne Rd
- 2357 Liberty St
- 1860 Sequoia St
- 1860 Issaquah St
- 907 Broadway St E
- 1120 Saxe Ave
- 298 Game Dr
- 135 Guise Park Dr
- 721 Myrtle Ave
- 2332 Providence Blvd
- 2316 Providence Blvd
- 2325 Anderson Rd
- 2308 Providence Blvd
- 2340 Providence Blvd
- 2317 Anderson Rd
- 2333 Anderson Rd
- 2325 Providence Blvd
- 2317 Providence Blvd
- 2341 Anderson Rd
- 2309 Anderson Rd
- 2300 Providence Blvd
- 2348 Providence Blvd
- 2337 Providence Blvd
- 2309 Providence Blvd
- 2301 Anderson Rd
- 2349 Anderson Rd
- 1660 Munroe Falls Ave Unit 1664
- 2301 Providence Blvd
- 2356 Providence Blvd