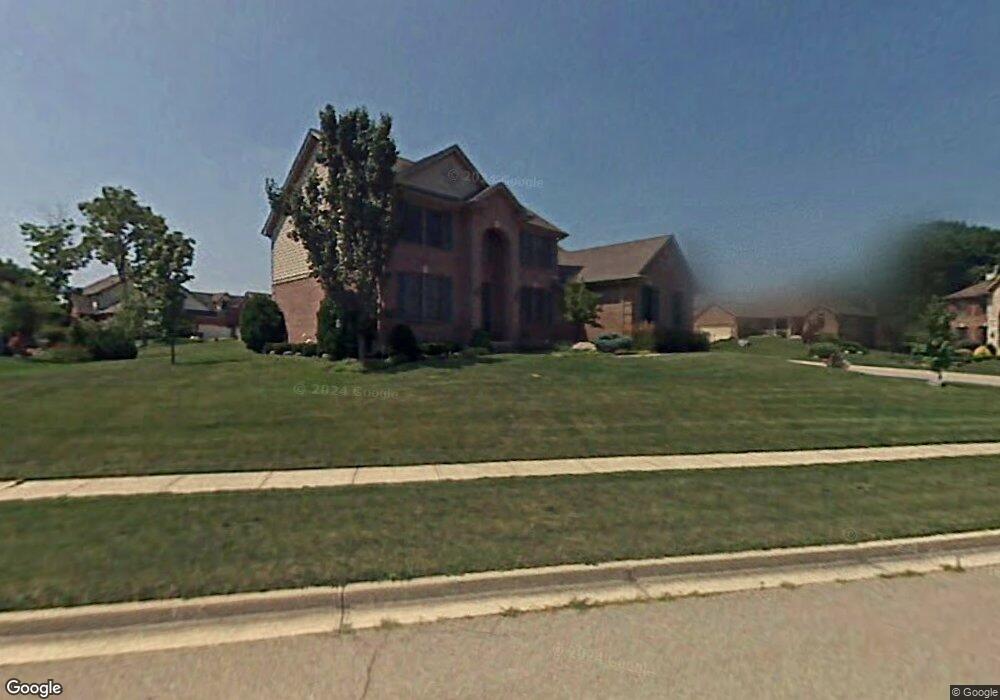
2324 Upper Trent Way Vandalia, OH 45377
Estimated Value: $432,248 - $499,000
4
Beds
4
Baths
2,702
Sq Ft
$173/Sq Ft
Est. Value
About This Home
This home is located at 2324 Upper Trent Way, Vandalia, OH 45377 and is currently estimated at $467,062, approximately $172 per square foot. 2324 Upper Trent Way is a home located in Montgomery County with nearby schools including Demmitt Elementary School, Smith Middle School, and Butler High School.
Ownership History
Date
Name
Owned For
Owner Type
Purchase Details
Closed on
Sep 8, 2021
Sold by
Bachman Rick J
Bought by
Gamble Steven and Gamble Racqueal
Current Estimated Value
Home Financials for this Owner
Home Financials are based on the most recent Mortgage that was taken out on this home.
Original Mortgage
$296,000
Outstanding Balance
$249,255
Interest Rate
2.8%
Mortgage Type
New Conventional
Estimated Equity
$217,807
Purchase Details
Closed on
May 2, 2017
Sold by
Bachman Laura L
Bought by
Bachman Rick J
Purchase Details
Closed on
Jun 27, 2001
Sold by
Bachman Rick J
Bought by
Bachman Rick J and Bachman Laura L
Purchase Details
Closed on
Dec 4, 1998
Sold by
Mcgovern Willoughby Home Inc
Bought by
Harsman Steven P and Harsman Amy M
Create a Home Valuation Report for This Property
The Home Valuation Report is an in-depth analysis detailing your home's value as well as a comparison with similar homes in the area
Home Values in the Area
Average Home Value in this Area
Purchase History
| Date | Buyer | Sale Price | Title Company |
|---|---|---|---|
| Gamble Steven | $370,000 | None Available | |
| Bachman Rick J | -- | None Available | |
| Bachman Rick J | -- | -- | |
| Harsman Steven P | $218,000 | -- | |
| Harsman Steven P | $218,000 | -- |
Source: Public Records
Mortgage History
| Date | Status | Borrower | Loan Amount |
|---|---|---|---|
| Open | Gamble Steven | $296,000 | |
| Closed | Gamble Steven | $296,000 |
Source: Public Records
Tax History Compared to Growth
Tax History
| Year | Tax Paid | Tax Assessment Tax Assessment Total Assessment is a certain percentage of the fair market value that is determined by local assessors to be the total taxable value of land and additions on the property. | Land | Improvement |
|---|---|---|---|---|
| 2024 | $5,484 | $105,310 | $17,330 | $87,980 |
| 2023 | $5,484 | $105,310 | $17,330 | $87,980 |
| 2022 | $6,161 | $95,740 | $15,750 | $79,990 |
| 2021 | $6,166 | $95,740 | $15,750 | $79,990 |
| 2020 | $6,148 | $95,740 | $15,750 | $79,990 |
| 2019 | $6,553 | $93,570 | $15,750 | $77,820 |
| 2018 | $6,566 | $93,570 | $15,750 | $77,820 |
| 2017 | $6,516 | $93,570 | $15,750 | $77,820 |
| 2016 | $6,062 | $85,520 | $15,750 | $69,770 |
| 2015 | $5,986 | $85,520 | $15,750 | $69,770 |
| 2014 | $5,986 | $85,520 | $15,750 | $69,770 |
| 2012 | -- | $89,130 | $21,000 | $68,130 |
Source: Public Records
Map
Nearby Homes
- 827 Foxfire Trail
- 668 Deerhurst Dr
- Fairfax Plan at Foxfire - Maple Street Collection
- Yosemite Plan at Foxfire - Maple Street Collection
- Cumberland Plan at Foxfire - Maple Street Collection
- Jensen Plan at Foxfire - Maple Street Collection
- Beacon Plan at Foxfire - Maple Street Collection
- Wesley Plan at Foxfire - Maple Street Collection
- Breckenridge Plan at Foxfire - Maple Street Collection
- Danville Plan at Foxfire - Maple Street Collection
- DaVinci Plan at Foxfire - Maple Street Collection
- Greenbriar Plan at Foxfire - Maple Street Collection
- 679 Deerhurst Dr
- 710 Deerhurst Dr
- 678 Deerhurst Dr
- 715 Deerhurst Dr
- 3518 Park Crest Ln
- 6494 Shore Dr
- 6512 Shore Dr
- 770 Deer Creek Dr
- 2338 Upper Trent Way
- 814 Bolton Abbey Ln
- 798 Bolton Abbey Ln
- 2312 Upper Trent Way
- 2329 Upper Trent Way
- 2350 Upper Trent Way
- 826 Bolton Abbey Ln
- 813 Bolton Abbey Ln
- 2337 Upper Trent Way
- 2341 Upper Trent Way
- 827 Bolton Abbey Ln
- 2362 Upper Trent Way
- 790 Bolton Abbey Ln
- 834 Bolton Abbey Ln
- 2326 Cheviot Hills Ln
- 804 Foxfire Trail
- 789 Bolton Abbey Ln
- 2336 Cheviot Hills Ln
- 810 Foxfire Trail
- 2330 Cheviot Hills Ln