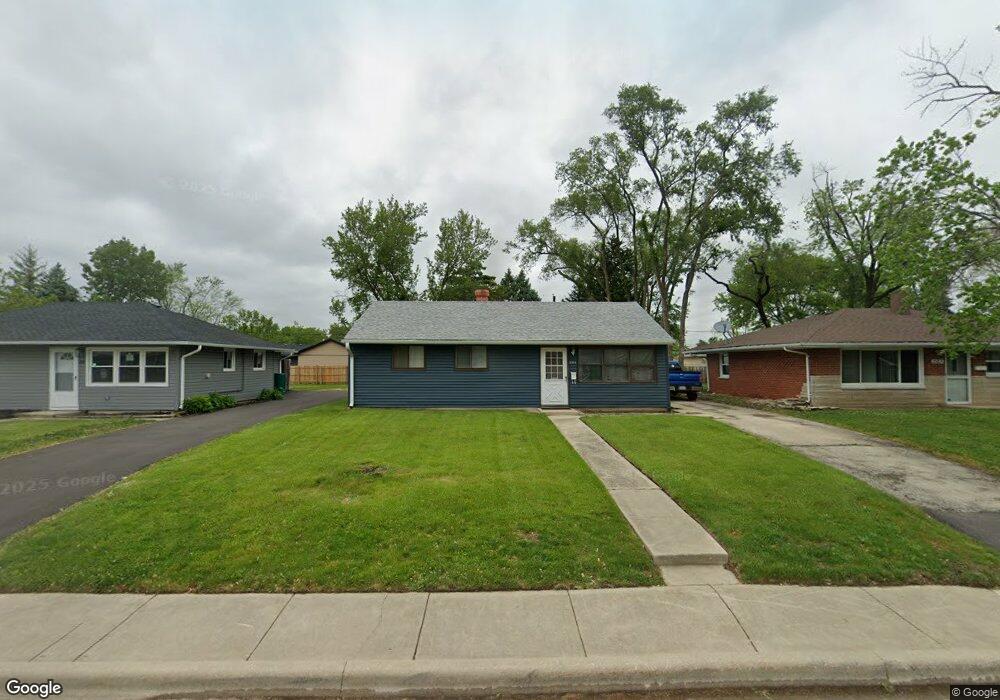
2325 Benedict Ave Joliet, IL 60436
Southwest Joliet NeighborhoodEstimated Value: $199,000 - $242,000
3
Beds
1
Bath
864
Sq Ft
$251/Sq Ft
Est. Value
About This Home
This home is located at 2325 Benedict Ave, Joliet, IL 60436 and is currently estimated at $216,863, approximately $250 per square foot. 2325 Benedict Ave is a home located in Will County with nearby schools including Lynne Thigpen Elementary School, Dirksen Junior High School, and Joliet West High School.
Ownership History
Date
Name
Owned For
Owner Type
Purchase Details
Closed on
Jul 2, 2019
Sold by
Gear Faxel James Carl
Bought by
Doty James and Doty Linda
Current Estimated Value
Home Financials for this Owner
Home Financials are based on the most recent Mortgage that was taken out on this home.
Original Mortgage
$88,549
Interest Rate
3.5%
Mortgage Type
New Conventional
Purchase Details
Closed on
Dec 3, 1993
Sold by
Conrad George R and Conrad Mildred R
Bought by
Gear James F
Home Financials for this Owner
Home Financials are based on the most recent Mortgage that was taken out on this home.
Original Mortgage
$48,800
Interest Rate
6.82%
Mortgage Type
Purchase Money Mortgage
Purchase Details
Closed on
Nov 23, 1993
Sold by
Litton Mtg Servicing Center Inc
Bought by
Conrad George R and Conrad Mildred R
Home Financials for this Owner
Home Financials are based on the most recent Mortgage that was taken out on this home.
Original Mortgage
$48,800
Interest Rate
6.82%
Mortgage Type
Purchase Money Mortgage
Create a Home Valuation Report for This Property
The Home Valuation Report is an in-depth analysis detailing your home's value as well as a comparison with similar homes in the area
Home Values in the Area
Average Home Value in this Area
Purchase History
| Date | Buyer | Sale Price | Title Company |
|---|---|---|---|
| Doty James | $90,000 | Attorney | |
| Gear James F | $61,000 | -- | |
| Conrad George R | $13,000 | -- |
Source: Public Records
Mortgage History
| Date | Status | Borrower | Loan Amount |
|---|---|---|---|
| Previous Owner | Doty James | $88,549 | |
| Previous Owner | Gear James F | $48,800 |
Source: Public Records
Tax History
| Year | Tax Paid | Tax Assessment Tax Assessment Total Assessment is a certain percentage of the fair market value that is determined by local assessors to be the total taxable value of land and additions on the property. | Land | Improvement |
|---|---|---|---|---|
| 2024 | $3,533 | $50,179 | $14,337 | $35,842 |
| 2023 | $3,533 | $44,583 | $12,738 | $31,845 |
| 2022 | $3,170 | $40,328 | $11,522 | $28,806 |
| 2021 | $2,976 | $37,665 | $10,761 | $26,904 |
| 2020 | $2,795 | $35,769 | $10,219 | $25,550 |
| 2019 | $3,194 | $33,242 | $9,497 | $23,745 |
| 2018 | $3,061 | $30,717 | $8,776 | $21,941 |
| 2017 | $2,885 | $27,927 | $7,979 | $19,948 |
| 2016 | $2,734 | $25,437 | $7,306 | $18,131 |
| 2015 | $2,632 | $23,850 | $6,850 | $17,000 |
| 2014 | $2,632 | $23,700 | $6,800 | $16,900 |
| 2013 | $2,632 | $25,692 | $7,565 | $18,127 |
Source: Public Records
Map
Nearby Homes
- 2226 Marmion Ave
- 2302 Madonna Ave
- 2308 Madonna Ave
- 2365 W Jefferson St
- 2530 Par Four Ct Unit C
- 112 Saint Jude Ave
- 2634 Crescenzo Dr Unit B
- 2651 Crescenzo Dr Unit 3
- 182 Saenz Ln Unit 2E
- 222 Madison St Unit 501
- 222 Madison St Unit 208
- 222 Madison St Unit 508
- 222 Madison St Unit 116
- 222 Madison St Unit 308
- 2700 Eagle Dr Unit 4
- 218 Madison St Unit 3B
- 216 Madison St Unit 1A
- 216 Madison St Unit 3C
- 216 Madison St Unit 3D
- 2689 Jodee Dr Unit B
- 2323 Benedict Ave
- 2329 Benedict Ave
- 2321 Benedict Ave
- 2322 Webster Ave
- 2320 Webster Ave
- 2324 Webster Ave
- 2319 Benedict Ave
- 2318 Webster Ave
- 2331 Benedict Ave
- 2302 Benedict Ave
- 2300 Benedict Ave
- 2326 Webster Ave
- 2304 Benedict Ave
- 2316 Webster Ave
- 102 Saint Joseph Ave
- 2317 Benedict Ave
- 2306 Benedict Ave
- 2222 Benedict Ave
- 2328 Webster Ave
- 2314 Webster Ave
Your Personal Tour Guide
Ask me questions while you tour the home.