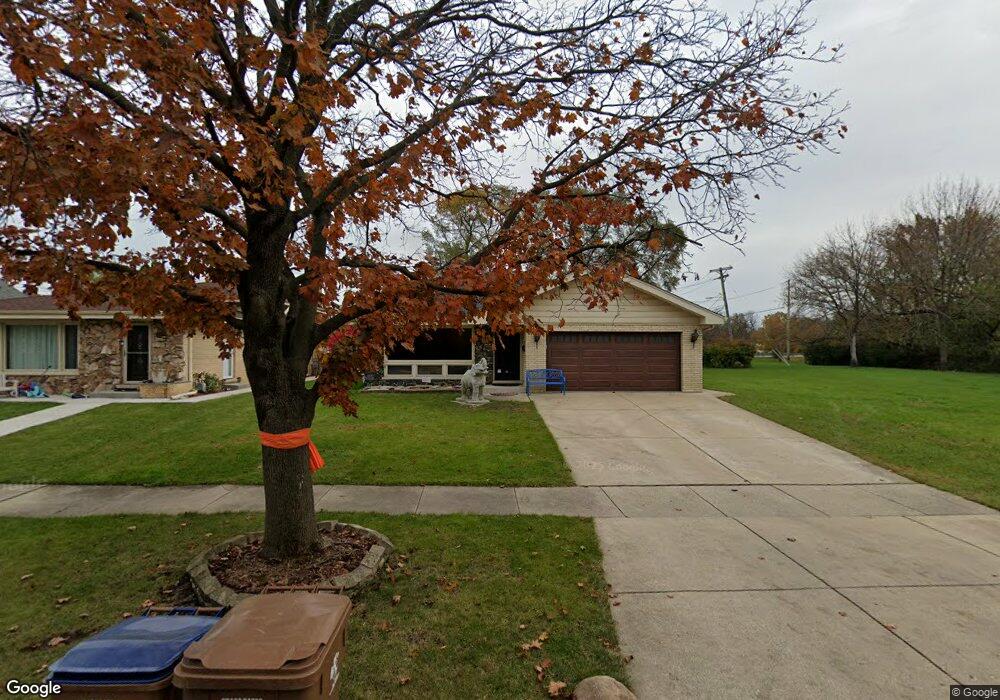
2325 S 18th Ave Broadview, IL 60155
Estimated Value: $285,261 - $311,000
3
Beds
1
Bath
1,379
Sq Ft
$216/Sq Ft
Est. Value
About This Home
This home is located at 2325 S 18th Ave, Broadview, IL 60155 and is currently estimated at $298,315, approximately $216 per square foot. 2325 S 18th Ave is a home located in Cook County with nearby schools including Lindop Elementary School and Proviso East High School.
Ownership History
Date
Name
Owned For
Owner Type
Purchase Details
Closed on
Jul 27, 2017
Sold by
Blattner Robert
Bought by
Holland Kenneth
Current Estimated Value
Home Financials for this Owner
Home Financials are based on the most recent Mortgage that was taken out on this home.
Original Mortgage
$220,825
Outstanding Balance
$185,783
Interest Rate
4.62%
Mortgage Type
FHA
Estimated Equity
$112,532
Purchase Details
Closed on
Mar 27, 2017
Sold by
U S Bank Na
Bought by
Blattner Robert
Purchase Details
Closed on
Dec 2, 2016
Sold by
Venson Vernee
Bought by
Us Rof Iv Legal Title Trust 2015 1
Purchase Details
Closed on
Sep 27, 1999
Sold by
Morris Wayne R and Morris Joanne M
Bought by
Venson Wynonia W
Home Financials for this Owner
Home Financials are based on the most recent Mortgage that was taken out on this home.
Original Mortgage
$125,000
Interest Rate
7.93%
Create a Home Valuation Report for This Property
The Home Valuation Report is an in-depth analysis detailing your home's value as well as a comparison with similar homes in the area
Home Values in the Area
Average Home Value in this Area
Purchase History
| Date | Buyer | Sale Price | Title Company |
|---|---|---|---|
| Holland Kenneth | $225,000 | Attorney | |
| Blattner Robert | $103,000 | Stewart Title | |
| Us Rof Iv Legal Title Trust 2015 1 | -- | Stewart Title | |
| Venson Wynonia W | -- | -- |
Source: Public Records
Mortgage History
| Date | Status | Borrower | Loan Amount |
|---|---|---|---|
| Open | Holland Kenneth | $220,825 | |
| Previous Owner | Venson Wynonia W | $125,000 |
Source: Public Records
Tax History
| Year | Tax Paid | Tax Assessment Tax Assessment Total Assessment is a certain percentage of the fair market value that is determined by local assessors to be the total taxable value of land and additions on the property. | Land | Improvement |
|---|---|---|---|---|
| 2025 | $3,327 | $11,435 | $1,843 | $9,592 |
| 2024 | $3,327 | $11,435 | $1,843 | $9,592 |
| 2023 | $2,781 | $11,435 | $1,843 | $9,592 |
| 2022 | $2,781 | $8,247 | $1,340 | $6,907 |
| 2021 | $2,649 | $8,246 | $1,340 | $6,906 |
| 2020 | $2,609 | $8,246 | $1,340 | $6,906 |
| 2019 | $2,193 | $6,715 | $1,256 | $5,459 |
| 2018 | $2,194 | $6,715 | $1,256 | $5,459 |
| 2017 | $2,172 | $6,715 | $1,256 | $5,459 |
| 2016 | $1,951 | $5,574 | $1,172 | $4,402 |
| 2015 | $1,903 | $5,574 | $1,172 | $4,402 |
| 2014 | $1,870 | $5,574 | $1,172 | $4,402 |
| 2013 | $2,188 | $6,775 | $1,172 | $5,603 |
Source: Public Records
Map
Nearby Homes
- 2433 S 17th Ave
- 2247 S 21st Ave
- 2510 S 17th Ave
- 2116 S 21st Ave
- 2341 S 24th Ave
- 2036 S 15th Ave
- 2218 S 11th Ave
- 2316 S 10th Ave
- 2111 S 24th Ave
- 1924 S 17th Ave
- 1908 S 18th Ave
- 2114 S 10th Ave
- 912 W Roosevelt Rd Unit 1
- 1909 S 20th Ave
- 1925 S 22nd Ave
- 1913 S 14th Ave
- 1910 S 22nd Ave
- 1110 W 18th St Unit GE
- 2007 S 25th Ave
- 2001 S 11th Ave
- 2325 S 18th Ave
- 2321 S 18th Ave
- 2331 S 18th Ave
- 2331 S 18th Ave
- 2331 S 18th Ave
- 2317 S 18th Ave
- 2337 S 18th Ave
- 2337 S 18th Ave
- 2324 S 17th Ave
- 2328 S 17th Ave
- 2320 S 17th Ave
- 2332 S 17th Ave
- 2313 S 18th Ave
- 2316 S 17th Ave
- 2336 S 17th Ave
- 2324 S 18th Ave
- 2341 S 18th Ave
- 2341 S 18th Ave
- 2328 S 18th Ave
- 2320 S 18th Ave
Your Personal Tour Guide
Ask me questions while you tour the home.