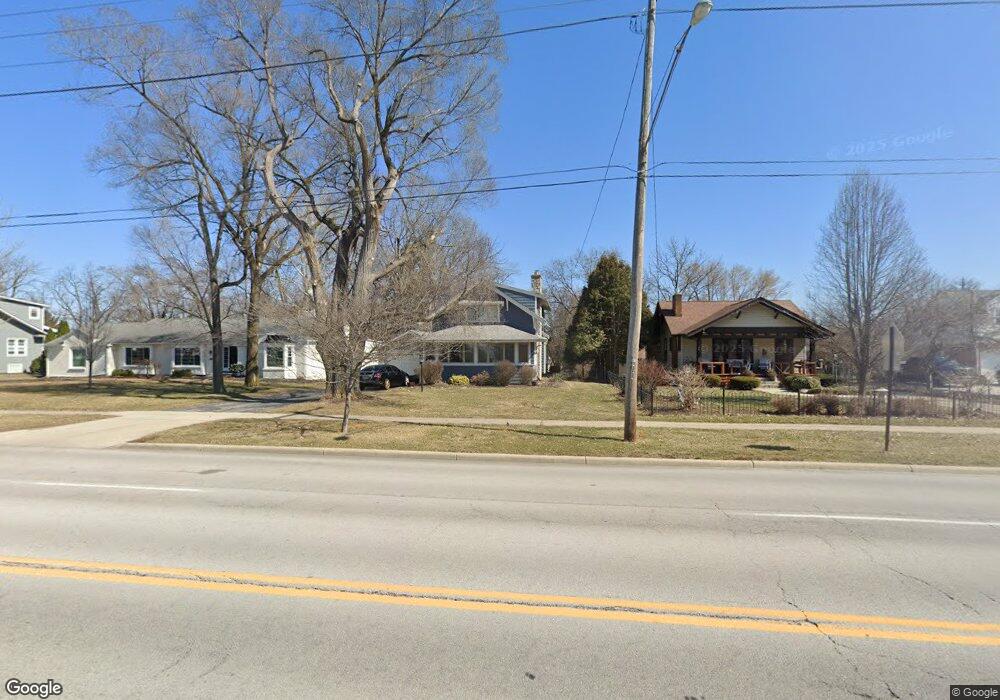
2325 S Main St Findlay, OH 45840
Estimated Value: $267,000 - $294,000
4
Beds
4
Baths
1,924
Sq Ft
$146/Sq Ft
Est. Value
About This Home
This home is located at 2325 S Main St, Findlay, OH 45840 and is currently estimated at $280,692, approximately $145 per square foot. 2325 S Main St is a home located in Hancock County with nearby schools including Chamberlin Hill Elementary School, Jefferson Elementary School, and Donnell Middle School.
Ownership History
Date
Name
Owned For
Owner Type
Purchase Details
Closed on
Jul 9, 2008
Sold by
Relocation Properties Management Llc
Bought by
Treece Alex K and Treece Jennifer L
Current Estimated Value
Home Financials for this Owner
Home Financials are based on the most recent Mortgage that was taken out on this home.
Original Mortgage
$150,636
Outstanding Balance
$97,573
Interest Rate
6.15%
Mortgage Type
FHA
Estimated Equity
$183,119
Purchase Details
Closed on
Mar 9, 1995
Sold by
Yates Dean
Bought by
Evans Thomas and Evans Cassie
Home Financials for this Owner
Home Financials are based on the most recent Mortgage that was taken out on this home.
Original Mortgage
$120,450
Interest Rate
8%
Mortgage Type
New Conventional
Purchase Details
Closed on
Mar 15, 1993
Bought by
Yates Dean J and Yates Joyce C
Purchase Details
Closed on
Sep 22, 1992
Bought by
Scasny Dorothy L
Create a Home Valuation Report for This Property
The Home Valuation Report is an in-depth analysis detailing your home's value as well as a comparison with similar homes in the area
Home Values in the Area
Average Home Value in this Area
Purchase History
| Date | Buyer | Sale Price | Title Company |
|---|---|---|---|
| Treece Alex K | $153,000 | Mid Am Title Agency | |
| Evans Thomas | $131,500 | -- | |
| Yates Dean J | $119,000 | -- | |
| Scasny Dorothy L | -- | -- |
Source: Public Records
Mortgage History
| Date | Status | Borrower | Loan Amount |
|---|---|---|---|
| Open | Treece Alex K | $150,636 | |
| Previous Owner | Evans Thomas | $120,450 |
Source: Public Records
Tax History
| Year | Tax Paid | Tax Assessment Tax Assessment Total Assessment is a certain percentage of the fair market value that is determined by local assessors to be the total taxable value of land and additions on the property. | Land | Improvement |
|---|---|---|---|---|
| 2024 | $2,375 | $66,850 | $8,490 | $58,360 |
| 2023 | $2,379 | $66,850 | $8,490 | $58,360 |
| 2022 | $2,370 | $66,850 | $8,490 | $58,360 |
| 2021 | $2,274 | $55,870 | $8,500 | $47,370 |
| 2020 | $2,274 | $55,870 | $8,500 | $47,370 |
| 2019 | $2,228 | $55,870 | $8,500 | $47,370 |
| 2018 | $2,046 | $47,030 | $5,670 | $41,360 |
| 2017 | $2,045 | $47,030 | $5,670 | $41,360 |
| 2016 | $2,017 | $47,030 | $5,670 | $41,360 |
| 2015 | $1,703 | $38,940 | $7,190 | $31,750 |
| 2014 | $1,703 | $38,940 | $7,190 | $31,750 |
| 2012 | $1,717 | $38,940 | $7,190 | $31,750 |
Source: Public Records
Map
Nearby Homes
- 242 E Yates Ave
- 209 E Hobart Ave
- 136 E Hobart Ave
- 3001 Goldenrod Ln
- 315 Fairlawn Place
- 400 E Pearl St
- 2925 Goldenrod Ln
- 0 Viburnum Ct Unit 10002881
- 0 Viburnum Ct Unit 10002879
- 0 Viburnum Ct Unit 10002878
- 0 Viburnum Ct Unit 10002880
- 0 Virbunum Ct Unit 87 305267
- 1304 Douglas Pkwy
- 324 W Mcpherson Ave
- 206 Greenlawn Ave
- 123 Glendale Ave
- 731 5th St
- 1726 Eastview Dr
- 0 Penrose Dr
- 1113 Hurd Ave
- 2327 S Main St
- 2321 S Main St
- 2335 S Main St
- 2317 S Main St
- 121 Woodley Terrace
- 120 Woodley Terrace
- 122 Woodley Ave
- 2311 S Main St
- 130 Woodley Ave
- 2401 S Main St
- 126 Woodley Terrace
- 123 E Yates Ave
- 129 Woodley Terrace
- 2419 S Main St
- 136 Woodley Ave
- 2305 S Main St
- 103 Woodley Ave
- 132 Woodley Terrace
- 133 Woodley Terrace
- 138 Woodley Ave
Your Personal Tour Guide
Ask me questions while you tour the home.