Estimated Value: $363,000 - $407,000
3
Beds
2
Baths
1,764
Sq Ft
$221/Sq Ft
Est. Value
About This Home
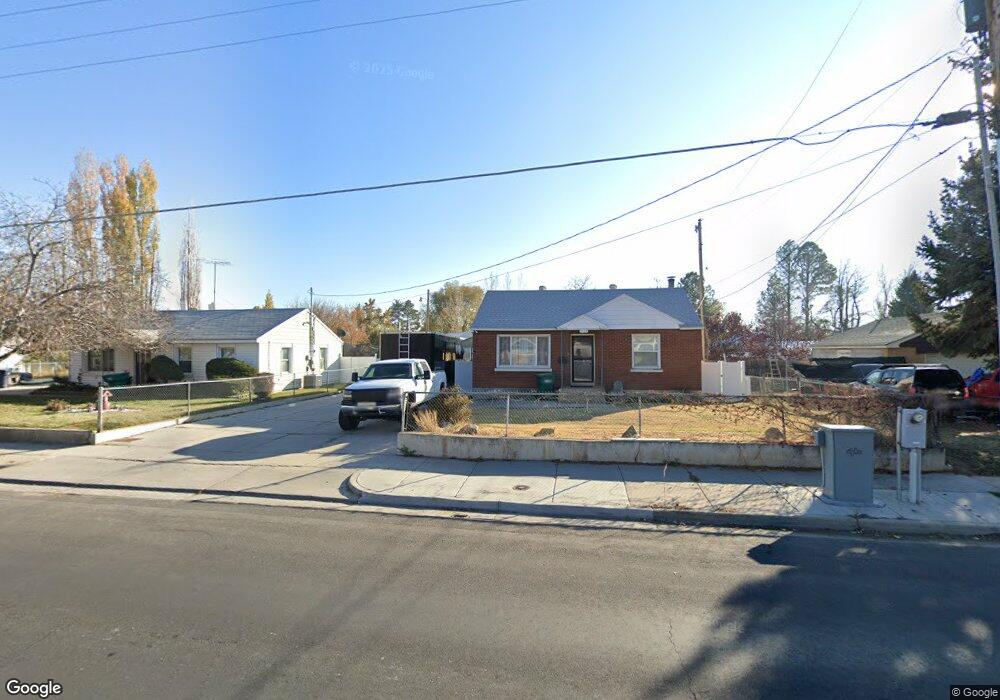
This home is located at 2325 W 4400 S, Roy, UT 84067 and is currently estimated at $390,473, approximately $221 per square foot. 2325 W 4400 S is a home located in Weber County with nearby schools including Valley View School, Sand Ridge Junior High School, and Roy High School.
Ownership History
Date
Name
Owned For
Owner Type
Purchase Details
Closed on
Oct 30, 2018
Sold by
Downs Todd A and Allen Down Living Trust
Bought by
Child Jason Watts
Current Estimated Value
Home Financials for this Owner
Home Financials are based on the most recent Mortgage that was taken out on this home.
Original Mortgage
$203,700
Outstanding Balance
$178,377
Interest Rate
4.6%
Mortgage Type
New Conventional
Estimated Equity
$212,096
Purchase Details
Closed on
Feb 15, 2018
Sold by
Downs Allen
Bought by
Downs Allen and Downs Todd A
Purchase Details
Closed on
Sep 21, 2009
Sold by
Dickamore Maxine P
Bought by
Fowers Stephen L and Fowers Rose M
Home Financials for this Owner
Home Financials are based on the most recent Mortgage that was taken out on this home.
Original Mortgage
$150,228
Interest Rate
5.18%
Mortgage Type
FHA
Purchase Details
Closed on
Aug 26, 2004
Sold by
Dickamore Maxine P
Bought by
Dickamore Maxine P
Purchase Details
Closed on
Jun 11, 2003
Sold by
Dickamore Maxine
Bought by
Livin Maxine Packham Dickamore Revocable
Create a Home Valuation Report for This Property
The Home Valuation Report is an in-depth analysis detailing your home's value as well as a comparison with similar homes in the area
Home Values in the Area
Average Home Value in this Area
Purchase History
| Date | Buyer | Sale Price | Title Company |
|---|---|---|---|
| Child Jason Watts | -- | Hickman Land Title Layton | |
| Downs Allen | -- | None Available | |
| Downs Allen | -- | None Available | |
| Fowers Stephen L | -- | First American Fashion Point | |
| Dickamore Maxine P | -- | -- | |
| Livin Maxine Packham Dickamore Revocable | -- | -- |
Source: Public Records
Mortgage History
| Date | Status | Borrower | Loan Amount |
|---|---|---|---|
| Open | Child Jason Watts | $203,700 | |
| Previous Owner | Fowers Stephen L | $150,228 |
Source: Public Records
Tax History Compared to Growth
Tax History
| Year | Tax Paid | Tax Assessment Tax Assessment Total Assessment is a certain percentage of the fair market value that is determined by local assessors to be the total taxable value of land and additions on the property. | Land | Improvement |
|---|---|---|---|---|
| 2025 | $2,301 | $356,712 | $122,453 | $234,259 |
| 2024 | $2,248 | $193,048 | $67,349 | $125,699 |
| 2023 | $1,977 | $167,750 | $63,182 | $104,568 |
| 2022 | $2,278 | $202,950 | $54,111 | $148,839 |
| 2021 | $1,781 | $258,000 | $70,478 | $187,522 |
| 2020 | $1,682 | $224,000 | $70,478 | $153,522 |
| 2019 | $1,607 | $201,000 | $41,274 | $159,726 |
| 2018 | $1,583 | $186,999 | $37,199 | $149,800 |
| 2017 | $1,376 | $149,999 | $37,199 | $112,800 |
| 2016 | $1,312 | $76,732 | $18,838 | $57,894 |
| 2015 | $1,163 | $68,794 | $18,838 | $49,956 |
| 2014 | $1,146 | $67,023 | $16,146 | $50,877 |
Source: Public Records
Map
Nearby Homes