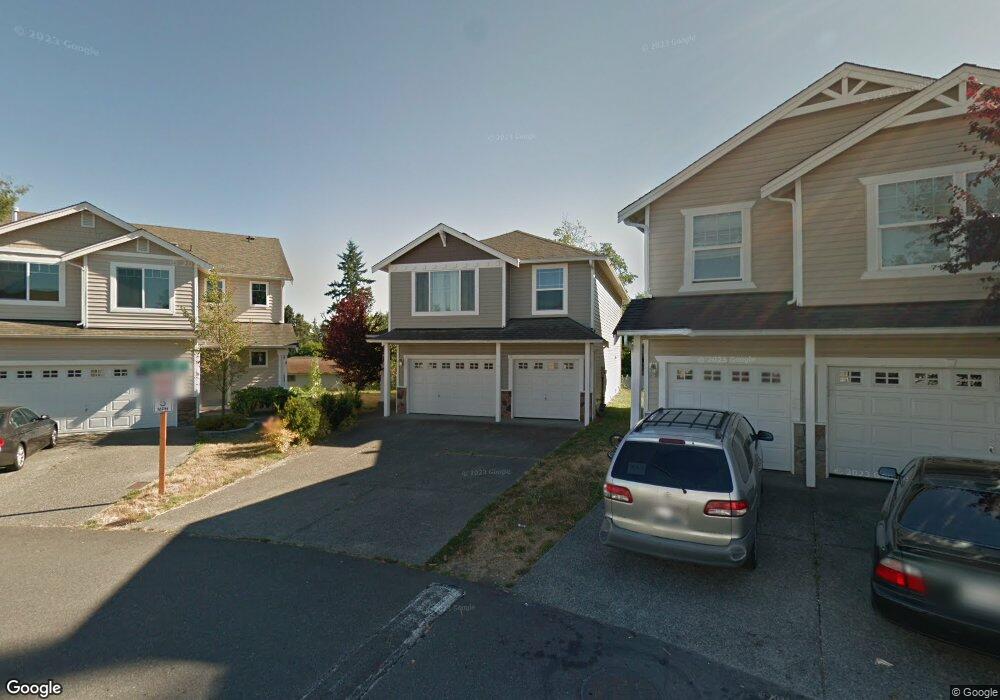
2326 115th Place SW Unit 4 Everett, WA 98204
Paine Field-Lake Stickney NeighborhoodEstimated Value: $636,000 - $732,000
4
Beds
3
Baths
2,067
Sq Ft
$329/Sq Ft
Est. Value
About This Home
This home is located at 2326 115th Place SW Unit 4, Everett, WA 98204 and is currently estimated at $680,778, approximately $329 per square foot. 2326 115th Place SW Unit 4 is a home located in Snohomish County with nearby schools including Fairmount Elementary School, Olympic View Middle School, and Mariner High School.
Ownership History
Date
Name
Owned For
Owner Type
Purchase Details
Closed on
Jun 29, 2009
Sold by
Accredited Home Lenders Inc
Bought by
Spencer Michelle L
Current Estimated Value
Home Financials for this Owner
Home Financials are based on the most recent Mortgage that was taken out on this home.
Original Mortgage
$212,000
Outstanding Balance
$135,238
Interest Rate
4.87%
Mortgage Type
Unknown
Estimated Equity
$545,540
Purchase Details
Closed on
Jan 28, 2009
Sold by
Bunsngeam Rongroeng and Bunma Linda
Bought by
Accredited Home Lenders Inc
Purchase Details
Closed on
Aug 16, 2006
Sold by
Impola Homes Inc
Bought by
Bunsngeam Rong Roeng and Bunma Linda
Home Financials for this Owner
Home Financials are based on the most recent Mortgage that was taken out on this home.
Original Mortgage
$281,342
Interest Rate
8.65%
Mortgage Type
Unknown
Create a Home Valuation Report for This Property
The Home Valuation Report is an in-depth analysis detailing your home's value as well as a comparison with similar homes in the area
Home Values in the Area
Average Home Value in this Area
Purchase History
| Date | Buyer | Sale Price | Title Company |
|---|---|---|---|
| Spencer Michelle L | $265,000 | Accommodation | |
| Accredited Home Lenders Inc | $247,500 | Fidelity National Title | |
| Bunsngeam Rong Roeng | $351,678 | Chicago Title |
Source: Public Records
Mortgage History
| Date | Status | Borrower | Loan Amount |
|---|---|---|---|
| Open | Spencer Michelle L | $212,000 | |
| Previous Owner | Bunsngeam Rong Roeng | $281,342 |
Source: Public Records
Tax History Compared to Growth
Tax History
| Year | Tax Paid | Tax Assessment Tax Assessment Total Assessment is a certain percentage of the fair market value that is determined by local assessors to be the total taxable value of land and additions on the property. | Land | Improvement |
|---|---|---|---|---|
| 2025 | $4,655 | $559,100 | $330,000 | $229,100 |
| 2024 | $4,655 | $545,800 | $310,000 | $235,800 |
| 2023 | $4,735 | $580,900 | $286,000 | $294,900 |
| 2022 | $4,316 | $447,300 | $194,000 | $253,300 |
| 2020 | $3,927 | $398,200 | $183,000 | $215,200 |
| 2019 | $3,626 | $368,600 | $153,000 | $215,600 |
| 2018 | $3,658 | $324,400 | $132,000 | $192,400 |
| 2017 | $3,398 | $308,400 | $115,000 | $193,400 |
| 2016 | $2,995 | $269,200 | $84,000 | $185,200 |
| 2015 | $3,118 | $257,000 | $77,000 | $180,000 |
| 2013 | $2,590 | $199,100 | $51,000 | $148,100 |
Source: Public Records
Map
Nearby Homes
- 11517 Marino Ave Unit B
- 10000 23rd Ave W
- 2101 Center Rd
- 2006 112th St SW
- 11104 Paine Field Way
- 11918 Airport Rd
- 14000 Center Rd
- 10811 Holly Dr Unit C
- 11527 Highway 99 Unit B303
- 11527 Highway 99 Unit C102
- 11527 Highway 99 Unit E305
- 10728 20th Place W
- 1612 Hollow Dale Place Unit 2C
- 2911 122nd St SW
- 1520 Hollow Dale Place Unit G
- 11626 Admiralty Way Unit A
- 1518 Hollow Dale Place Unit D
- 1516 Hollow Dale Place Unit C
- The Alpine Plan at Hollowdale
- The Cascade Plan at Hollowdale
- 2322 115th Place SW Unit 5
- 11512 23rd Place W Unit 3
- 2318 115th Place SW
- 11527 Marino Ave
- 11517 Marino Ave
- 11511 Marino Ave
- 2314 115th Place SW Unit 7
- 11511 23rd Place W
- 11521 Marino Ave
- 11513 Marino Ave
- 11506 23rd Place W
- 11506 23rd Place W Unit 1
- 11525 Marino Ave
- 2310 115th Place SW Unit 8
- 11529 Marino Ave
- 11508 23rd Ave W Unit 53
- 11507 Marino Ave
- 11501 23rd Place W Unit 37
- 11504 23rd Ave W Unit 52