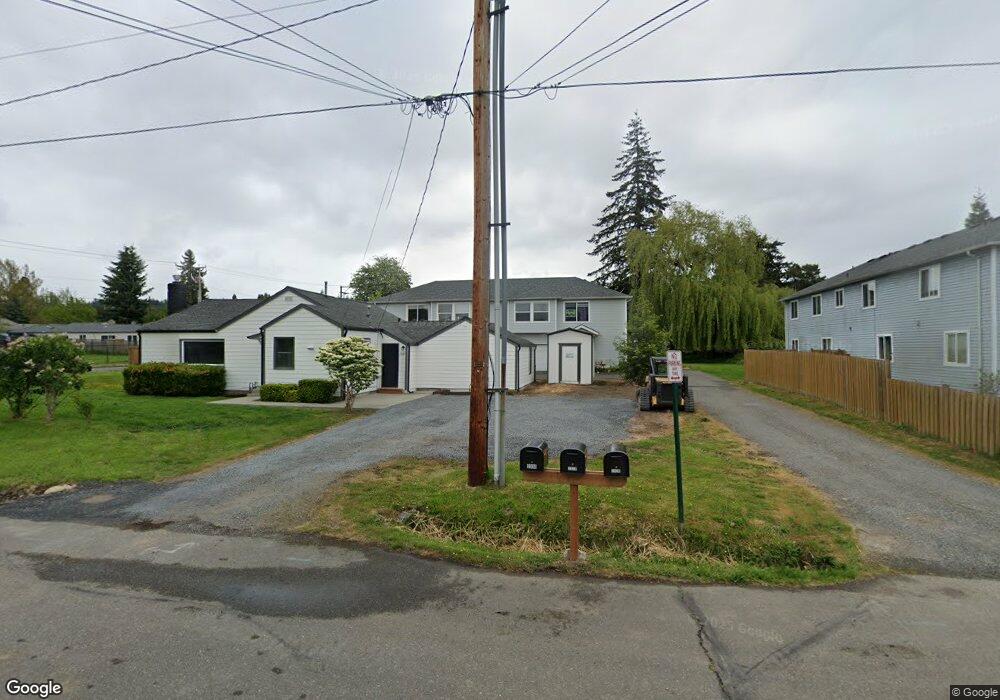
2326 Xenia St Bellingham, WA 98229
Roosevelt NeighborhoodEstimated Value: $776,000 - $810,000
3
Beds
2
Baths
2,473
Sq Ft
$319/Sq Ft
Est. Value
About This Home
This home is located at 2326 Xenia St, Bellingham, WA 98229 and is currently estimated at $789,322, approximately $319 per square foot. 2326 Xenia St is a home located in Whatcom County with nearby schools including Roosevelt Elementary School, Kulshan Middle School, and Bellingham High School.
Ownership History
Date
Name
Owned For
Owner Type
Purchase Details
Closed on
Jul 19, 2012
Sold by
Stephens John D
Bought by
Woods K Roger
Current Estimated Value
Home Financials for this Owner
Home Financials are based on the most recent Mortgage that was taken out on this home.
Original Mortgage
$198,700
Outstanding Balance
$136,900
Interest Rate
3.63%
Mortgage Type
New Conventional
Estimated Equity
$652,422
Purchase Details
Closed on
Jun 18, 2012
Sold by
Woods Jennifer J and Roger Woods K
Bought by
Woods K Roger
Home Financials for this Owner
Home Financials are based on the most recent Mortgage that was taken out on this home.
Original Mortgage
$198,700
Outstanding Balance
$136,900
Interest Rate
3.63%
Mortgage Type
New Conventional
Estimated Equity
$652,422
Create a Home Valuation Report for This Property
The Home Valuation Report is an in-depth analysis detailing your home's value as well as a comparison with similar homes in the area
Home Values in the Area
Average Home Value in this Area
Purchase History
| Date | Buyer | Sale Price | Title Company |
|---|---|---|---|
| Woods K Roger | $265,280 | Whatcom Land Title | |
| Woods K Roger | -- | Whatcom Land Title |
Source: Public Records
Mortgage History
| Date | Status | Borrower | Loan Amount |
|---|---|---|---|
| Open | Woods K Roger | $198,700 |
Source: Public Records
Tax History Compared to Growth
Tax History
| Year | Tax Paid | Tax Assessment Tax Assessment Total Assessment is a certain percentage of the fair market value that is determined by local assessors to be the total taxable value of land and additions on the property. | Land | Improvement |
|---|---|---|---|---|
| 2024 | $6,083 | $743,127 | $269,395 | $473,732 |
| 2023 | $5,930 | $762,002 | $276,238 | $485,764 |
| 2022 | $4,843 | $656,910 | $238,140 | $418,770 |
| 2021 | $4,751 | $521,357 | $189,000 | $332,357 |
| 2020 | $4,031 | $482,738 | $175,000 | $307,738 |
| 2019 | $3,609 | $395,898 | $124,778 | $271,120 |
| 2018 | $3,634 | $355,366 | $112,028 | $243,338 |
| 2017 | $3,136 | $305,960 | $96,450 | $209,510 |
| 2016 | $2,744 | $275,958 | $86,550 | $189,408 |
| 2015 | $2,690 | $251,299 | $79,050 | $172,249 |
| 2014 | -- | $238,424 | $75,000 | $163,424 |
| 2013 | -- | $261,528 | $73,500 | $188,028 |
Source: Public Records
Map
Nearby Homes
- 2316 Xenia St
- 2409 Xenia St
- 2138 Woburn St
- 2325 Valencia St
- 2330 Verona St
- 2602 Woburn St
- 950 Yew St
- 2735 Michigan St
- 1735 Sunup Loop
- 1737 Sunup Loop
- 1733 Sunup Loop
- 2312 Orleans St
- 2209 W Birch St
- 1712 Sunup Loop
- 1714 Sunup Loop
- 1716 Sunup Loop
- 2612 Birch St
- 2104 Birch Cir Unit 5C
- 3700 Alabama St Unit 316
- 3374 Southbend Place Unit 101