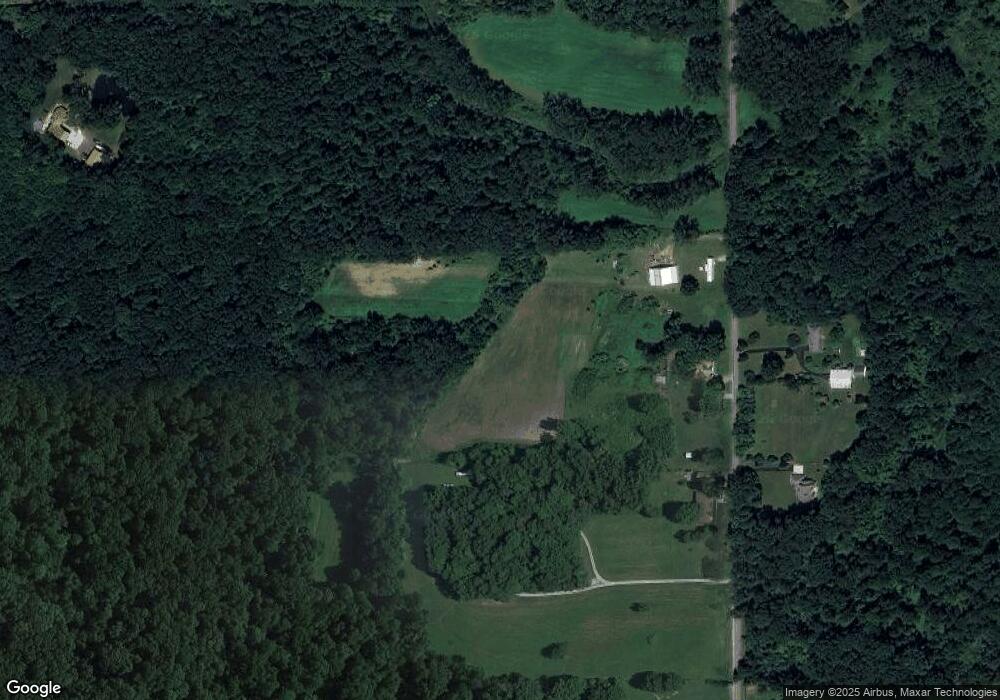
2327 Oak Rd Plymouth, IN 46563
Estimated Value: $190,000 - $292,250
3
Beds
1
Bath
1,408
Sq Ft
$169/Sq Ft
Est. Value
About This Home
This home is located at 2327 Oak Rd, Plymouth, IN 46563 and is currently estimated at $238,563, approximately $169 per square foot. 2327 Oak Rd is a home located in Marshall County with nearby schools including LaVille Elementary School and LaVille Junior - Senior High School.
Ownership History
Date
Name
Owned For
Owner Type
Purchase Details
Closed on
Oct 16, 2020
Sold by
Evelyn L Turnage Revocabe Living Trust
Bought by
Thompson Aaron R
Current Estimated Value
Home Financials for this Owner
Home Financials are based on the most recent Mortgage that was taken out on this home.
Original Mortgage
$89,898
Outstanding Balance
$79,814
Interest Rate
2.8%
Mortgage Type
New Conventional
Estimated Equity
$158,749
Purchase Details
Closed on
Oct 17, 2005
Sold by
Turnage Evelyn L
Bought by
Evelyn L Turnage Revocable Living Trust
Create a Home Valuation Report for This Property
The Home Valuation Report is an in-depth analysis detailing your home's value as well as a comparison with similar homes in the area
Home Values in the Area
Average Home Value in this Area
Purchase History
| Date | Buyer | Sale Price | Title Company |
|---|---|---|---|
| Thompson Aaron R | -- | Meridian Title Corp | |
| Evelyn L Turnage Revocable Living Trust | -- | None Available |
Source: Public Records
Mortgage History
| Date | Status | Borrower | Loan Amount |
|---|---|---|---|
| Open | Thompson Aaron R | $89,898 |
Source: Public Records
Tax History Compared to Growth
Tax History
| Year | Tax Paid | Tax Assessment Tax Assessment Total Assessment is a certain percentage of the fair market value that is determined by local assessors to be the total taxable value of land and additions on the property. | Land | Improvement |
|---|---|---|---|---|
| 2024 | $1,777 | $194,700 | $117,500 | $77,200 |
| 2022 | $1,777 | $174,900 | $109,700 | $65,200 |
| 2021 | $1,265 | $131,800 | $81,300 | $50,500 |
| 2020 | $512 | $95,500 | $46,800 | $48,700 |
| 2019 | $535 | $95,500 | $48,500 | $47,000 |
| 2018 | $529 | $90,600 | $49,100 | $41,500 |
| 2017 | $424 | $91,000 | $50,900 | $40,100 |
| 2016 | $471 | $90,000 | $51,100 | $38,900 |
| 2014 | $387 | $86,900 | $47,000 | $39,900 |
Source: Public Records
Map
Nearby Homes