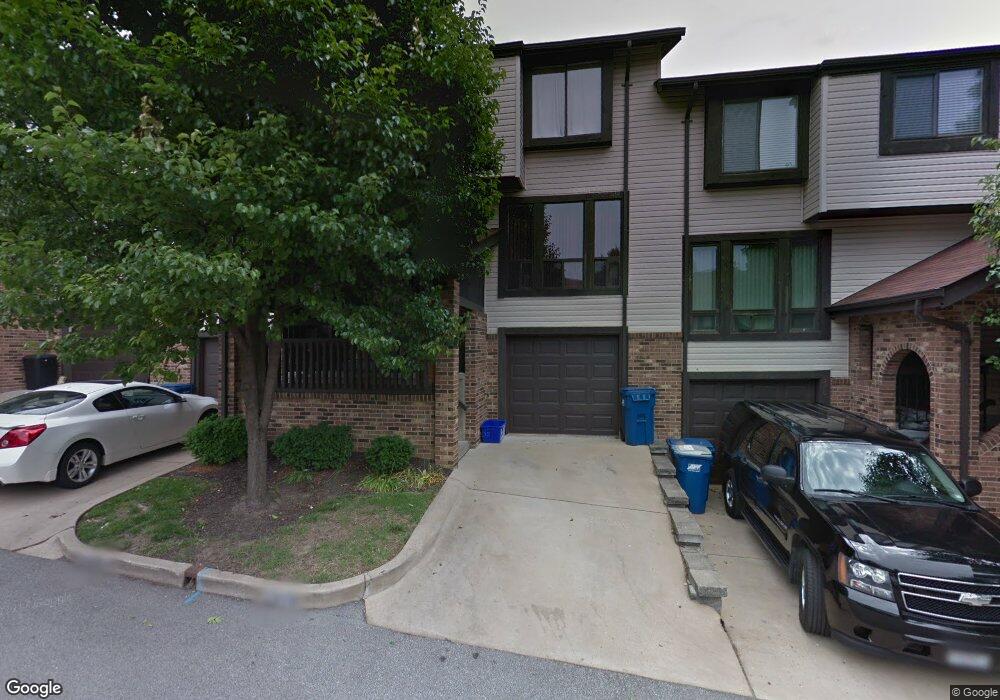
2328 Driftwood Place Unit 3E Saint Louis, MO 63146
Estimated Value: $202,005 - $257,000
2
Beds
3
Baths
1,308
Sq Ft
$174/Sq Ft
Est. Value
About This Home
This home is located at 2328 Driftwood Place Unit 3E, Saint Louis, MO 63146 and is currently estimated at $228,001, approximately $174 per square foot. 2328 Driftwood Place Unit 3E is a home located in St. Louis County with nearby schools including Ross Elementary School, Parkway Northeast Middle School, and Parkway North High School.
Ownership History
Date
Name
Owned For
Owner Type
Purchase Details
Closed on
Oct 11, 2023
Sold by
Shapshovich Eduard and Shapshovich Inna
Bought by
Ace Property Management Llc
Current Estimated Value
Purchase Details
Closed on
Aug 23, 2001
Sold by
Herring Judy Fay and Herring James Russell
Bought by
First Union National Bank Of Delaware
Home Financials for this Owner
Home Financials are based on the most recent Mortgage that was taken out on this home.
Original Mortgage
$83,500
Interest Rate
7.05%
Purchase Details
Closed on
Jul 27, 2001
Sold by
Beyer Michael D
Bought by
Shapshovich Eduard
Home Financials for this Owner
Home Financials are based on the most recent Mortgage that was taken out on this home.
Original Mortgage
$83,500
Interest Rate
7.05%
Create a Home Valuation Report for This Property
The Home Valuation Report is an in-depth analysis detailing your home's value as well as a comparison with similar homes in the area
Home Values in the Area
Average Home Value in this Area
Purchase History
| Date | Buyer | Sale Price | Title Company |
|---|---|---|---|
| Ace Property Management Llc | -- | Title Partners | |
| First Union National Bank Of Delaware | $35,586 | First American Title Co | |
| Shapshovich Eduard | $98,250 | -- |
Source: Public Records
Mortgage History
| Date | Status | Borrower | Loan Amount |
|---|---|---|---|
| Previous Owner | Shapshovich Eduard | $83,500 |
Source: Public Records
Tax History Compared to Growth
Tax History
| Year | Tax Paid | Tax Assessment Tax Assessment Total Assessment is a certain percentage of the fair market value that is determined by local assessors to be the total taxable value of land and additions on the property. | Land | Improvement |
|---|---|---|---|---|
| 2025 | $2,481 | $40,510 | $14,420 | $26,090 |
| 2024 | $2,481 | $35,210 | $6,840 | $28,370 |
| 2023 | $2,457 | $35,210 | $6,840 | $28,370 |
| 2022 | $2,221 | $29,110 | $8,950 | $20,160 |
| 2021 | $2,243 | $29,110 | $8,950 | $20,160 |
| 2020 | $2,117 | $27,740 | $7,450 | $20,290 |
| 2019 | $2,090 | $27,740 | $7,450 | $20,290 |
| 2018 | $1,635 | $20,010 | $3,480 | $16,530 |
| 2017 | $1,617 | $20,010 | $3,480 | $16,530 |
| 2016 | $1,513 | $17,840 | $3,970 | $13,870 |
| 2015 | $1,581 | $17,840 | $3,970 | $13,870 |
| 2014 | $1,423 | $17,590 | $3,550 | $14,040 |
Source: Public Records
Map
Nearby Homes
- 2025 Maryland Oaks Cir
- 2021 Maryland Oaks Cir
- 1960 Marine Terrace Dr Unit H
- 1960 Marine Terrace Dr Unit K
- 1948 Marine Terrace Dr Unit A
- 2115 Riding Spur Dr
- 1935 Marine Terrace Dr Unit D
- 1718 Pheasant Run Dr
- 12558 Pepperwood Dr
- 1827 Pheasant Run Dr
- 13021 Marine Ave
- 1759 Roth Hill Dr
- 12818 Willowyck Dr
- 12725 Westport Dr
- 1834 Chelmsford Ct
- 13112 Royal Pines Dr
- 13176 Royal Pines Dr Unit 2
- 2368 Seven Pines Dr Unit 2
- 13191 Royal Pines Dr Unit 1
- 2314 Seven Pines Dr Unit 8
- 2326 Driftwood Place Unit 3D
- 2322 Driftwood Place
- 2324 Driftwood Place
- 2316 Driftwood Place
- 2314 Driftwood Place Unit 2G
- 2312 Driftwood Place
- 2320 Driftwood Place
- 2332 Driftwood Place Unit 3G
- 2330 Driftwood Place
- 2325 Driftwood Place Unit 1H
- 2321 Driftwood Place
- 2317 Driftwood Place Unit 1D
- 2334 Driftwood Place Unit 3H
- 2310 Driftwood Place
- 2336 Driftwood Place
- 2308 Driftwood Place
- 2323 Driftwood Place
- 2327 Driftwood Place
- 2319 Driftwood Place
- 2315 Driftwood Place