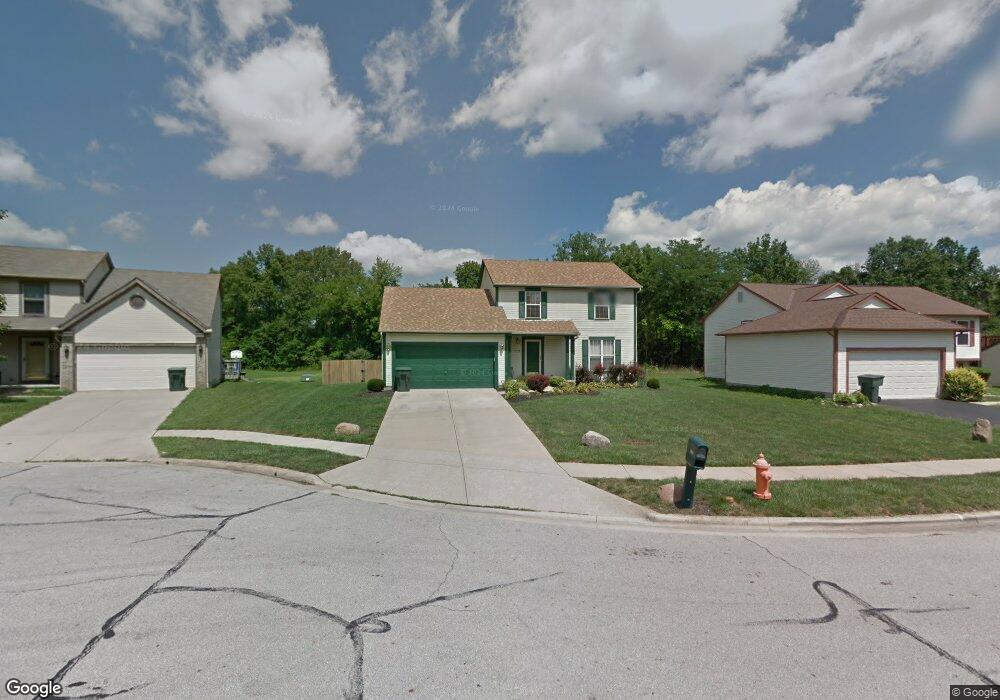
2328 Minerva Park Place Columbus, OH 43229
Forest Park East NeighborhoodEstimated Value: $287,000 - $328,000
3
Beds
3
Baths
1,696
Sq Ft
$180/Sq Ft
Est. Value
About This Home
This home is located at 2328 Minerva Park Place, Columbus, OH 43229 and is currently estimated at $305,641, approximately $180 per square foot. 2328 Minerva Park Place is a home located in Franklin County with nearby schools including Avalon Elementary School, Northgate Intermediate, and Woodward Park Middle School.
Ownership History
Date
Name
Owned For
Owner Type
Purchase Details
Closed on
Jun 22, 2007
Sold by
Curd Francis M and Curd Pamela G
Bought by
Curd Watson Otha L and Curd Watson Sharon
Current Estimated Value
Home Financials for this Owner
Home Financials are based on the most recent Mortgage that was taken out on this home.
Original Mortgage
$125,000
Outstanding Balance
$77,230
Interest Rate
6.37%
Mortgage Type
Purchase Money Mortgage
Estimated Equity
$228,411
Purchase Details
Closed on
Dec 23, 2005
Sold by
Watson Otha L and Watson Sharon A
Bought by
Curd Francis M and Curd Pamela G
Home Financials for this Owner
Home Financials are based on the most recent Mortgage that was taken out on this home.
Original Mortgage
$121,500
Interest Rate
6.46%
Mortgage Type
Fannie Mae Freddie Mac
Purchase Details
Closed on
May 22, 1997
Sold by
Homewood Building Company
Bought by
Watson Otha L and Curd Sharon A
Create a Home Valuation Report for This Property
The Home Valuation Report is an in-depth analysis detailing your home's value as well as a comparison with similar homes in the area
Home Values in the Area
Average Home Value in this Area
Purchase History
| Date | Buyer | Sale Price | Title Company |
|---|---|---|---|
| Curd Watson Otha L | $125,000 | Attorney | |
| Curd Francis M | $135,000 | None Available | |
| Watson Otha L | $121,100 | Preferred Title Agency Inc |
Source: Public Records
Mortgage History
| Date | Status | Borrower | Loan Amount |
|---|---|---|---|
| Open | Curd Watson Otha L | $125,000 | |
| Previous Owner | Curd Francis M | $121,500 |
Source: Public Records
Tax History Compared to Growth
Tax History
| Year | Tax Paid | Tax Assessment Tax Assessment Total Assessment is a certain percentage of the fair market value that is determined by local assessors to be the total taxable value of land and additions on the property. | Land | Improvement |
|---|---|---|---|---|
| 2024 | $3,547 | $79,030 | $22,750 | $56,280 |
| 2023 | $3,502 | $79,030 | $22,750 | $56,280 |
| 2022 | $3,100 | $59,780 | $11,830 | $47,950 |
| 2021 | $3,106 | $59,780 | $11,830 | $47,950 |
| 2020 | $3,110 | $59,780 | $11,830 | $47,950 |
| 2019 | $2,665 | $43,930 | $8,750 | $35,180 |
| 2018 | $2,538 | $43,930 | $8,750 | $35,180 |
| 2017 | $2,663 | $43,930 | $8,750 | $35,180 |
| 2016 | $2,662 | $40,180 | $8,260 | $31,920 |
| 2015 | $2,416 | $40,180 | $8,260 | $31,920 |
| 2014 | $2,422 | $40,180 | $8,260 | $31,920 |
| 2013 | $1,257 | $42,280 | $8,680 | $33,600 |
Source: Public Records
Map
Nearby Homes
- 2550 Minerva Ave
- 2500 Maplewood Dr
- 2208 Pine Knoll Ave
- 2294 Teakwood Dr
- 5056 Northtowne Blvd Unit 5054
- 2158 Kilbourne Ave
- 5204 Honeytree Loop W
- 2058 Northcliff Dr
- 5357 Torchwood Loop W
- 4885 Northtowne Blvd
- 2734 Alder Vista Dr
- 2134 Trent Rd
- 0 Alder Vista Dr
- 4849 Heatherton Dr
- 5556 Parkshire Dr Unit 5556
- 0 Claridon Rd
- 2903 Kilbourne Ave
- 2576 Claridon Rd
- 2244 Balmoral Rd
- 2033 Brittany Rd
- 2336 Minerva Park Place
- 2320 Minerva Park Place
- 2344 Minerva Park Place
- 2312 Minerva Park Place
- 2327 Minerva Park Place
- 2335 Minerva Park Place
- 2352 Minerva Park Place
- 2319 Minerva Park Place
- 2343 Minerva Park Place
- 2311 Minerva Park Place
- 2360 Minerva Park Place
- 2351 Minerva Park Place
- 5128 Avalon Ave
- 5136 Avalon Ave
- 5120 Avalon Ave
- 2324 Rolling Rock Dr
- 5144 Avalon Ave
- 2316 Rolling Rock Dr
- 2359 Minerva Park Place
- 2332 Rolling Rock Dr