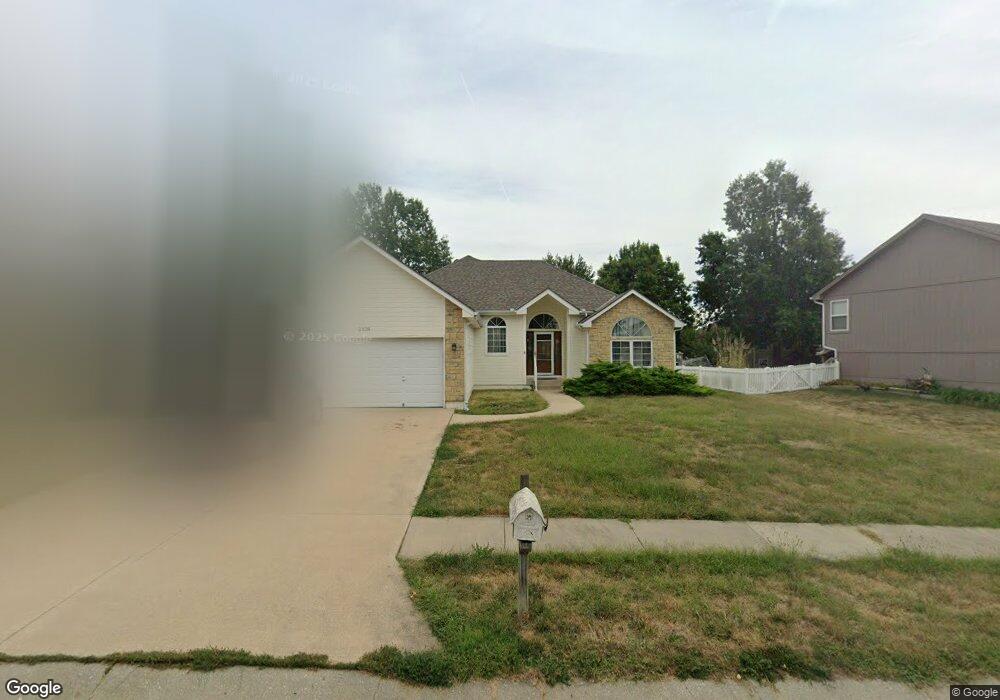
2328 NE Summerfield Dr Blue Springs, MO 64029
Estimated Value: $328,088 - $347,000
3
Beds
2
Baths
1,528
Sq Ft
$223/Sq Ft
Est. Value
About This Home
This home is located at 2328 NE Summerfield Dr, Blue Springs, MO 64029 and is currently estimated at $340,272, approximately $222 per square foot. 2328 NE Summerfield Dr is a home located in Jackson County with nearby schools including Grain Valley High School and St John Lalande School.
Ownership History
Date
Name
Owned For
Owner Type
Purchase Details
Closed on
May 1, 2007
Sold by
Swank Jerry L and Swank Rosemary L
Bought by
Clevenger Roberta E
Current Estimated Value
Purchase Details
Closed on
Apr 24, 2003
Sold by
Kratz Steven L and Kratz Kelly A
Bought by
Swank Jerry L and Swank Rosemary L
Home Financials for this Owner
Home Financials are based on the most recent Mortgage that was taken out on this home.
Original Mortgage
$148,105
Interest Rate
5.57%
Mortgage Type
Purchase Money Mortgage
Purchase Details
Closed on
Jan 30, 2001
Sold by
Hodges Charles E and Hodges Kelly A
Bought by
Kratz Steven L and Kratz Kelly A
Home Financials for this Owner
Home Financials are based on the most recent Mortgage that was taken out on this home.
Original Mortgage
$130,050
Interest Rate
7.21%
Mortgage Type
Purchase Money Mortgage
Purchase Details
Closed on
May 8, 2000
Sold by
Summerfield Development Company
Bought by
Hodges Charles E and Hodges Kelly A
Home Financials for this Owner
Home Financials are based on the most recent Mortgage that was taken out on this home.
Original Mortgage
$133,000
Interest Rate
8.18%
Mortgage Type
Construction
Create a Home Valuation Report for This Property
The Home Valuation Report is an in-depth analysis detailing your home's value as well as a comparison with similar homes in the area
Home Values in the Area
Average Home Value in this Area
Purchase History
| Date | Buyer | Sale Price | Title Company |
|---|---|---|---|
| Clevenger Roberta E | -- | Kansas City Title | |
| Swank Jerry L | -- | Stewart Title Of Kansas City | |
| Kratz Steven L | -- | Stewart Title | |
| Hodges Charles E | -- | Stewart Title |
Source: Public Records
Mortgage History
| Date | Status | Borrower | Loan Amount |
|---|---|---|---|
| Previous Owner | Swank Jerry L | $148,105 | |
| Previous Owner | Kratz Steven L | $130,050 | |
| Previous Owner | Hodges Charles E | $133,000 |
Source: Public Records
Tax History Compared to Growth
Tax History
| Year | Tax Paid | Tax Assessment Tax Assessment Total Assessment is a certain percentage of the fair market value that is determined by local assessors to be the total taxable value of land and additions on the property. | Land | Improvement |
|---|---|---|---|---|
| 2025 | $3,045 | $45,317 | $7,002 | $38,315 |
| 2024 | $3,045 | $39,406 | $5,881 | $33,525 |
| 2023 | $2,926 | $39,406 | $5,096 | $34,310 |
| 2022 | $2,901 | $35,150 | $4,266 | $30,884 |
| 2021 | $2,826 | $35,150 | $4,266 | $30,884 |
| 2020 | $2,831 | $35,132 | $4,266 | $30,866 |
| 2019 | $2,754 | $35,132 | $4,266 | $30,866 |
| 2018 | $2,568 | $30,576 | $3,712 | $26,864 |
| 2017 | $2,568 | $30,576 | $3,712 | $26,864 |
| 2016 | $2,400 | $28,557 | $3,762 | $24,795 |
| 2014 | $2,159 | $25,428 | $3,863 | $21,565 |
Source: Public Records
Map
Nearby Homes
- 2360 NE Colonnade Ave
- 2352 NE Colonnade Ave
- 2353 NE Colonnade Ave
- 2369 NE Colonnade Ave
- 2344 NE Colonnade Ave
- 2373 NE Colonnade Ave
- 2345 NE Colonnade Ave
- 2341 NE Colonnade Ave
- 2340 NE Colonnade Ave
- 2372 NE Colonnade Ave
- 2376 NE Skopelos Ct
- 2309 NE 23rd St
- 2237 NE Maybrook Dr
- 2367 NE Skopelos Ct
- 2304 NE 23rd St
- 2332 NE Andromada Ct
- 2400 NE Porter Rd
- 2210 NE Treetop Dr
- 2104 NE Wyndham Place
- 1855 NE Duncan Rd
- 2332 NE Summerfield Dr
- 2324 NE Summerfield Dr
- 2336 NE Summerfield Dr
- 2341 NE Overbrook Dr
- 2345 NE Overbrook Dr
- 2327 NE Summerfield Dr
- 2349 NE Overbrook Dr
- 2337 NE Overbrook Dr
- 2331 NE Summerfield Dr
- 2315 NE Overbrook Dr
- 2340 NE Summerfield Dr
- 2353 NE Overbrook Dr
- 2335 NE Summerfield Dr
- 2319 NE Summerfield Dr
- 2339 NE Summerfield Dr
- 2011 NE Overbrook Dr
- 2342 NE Overbrook Dr
- 2344 NE Summerfield Dr
- 2357 NE Overbrook Dr
- 2007 NE Overbrook Dr