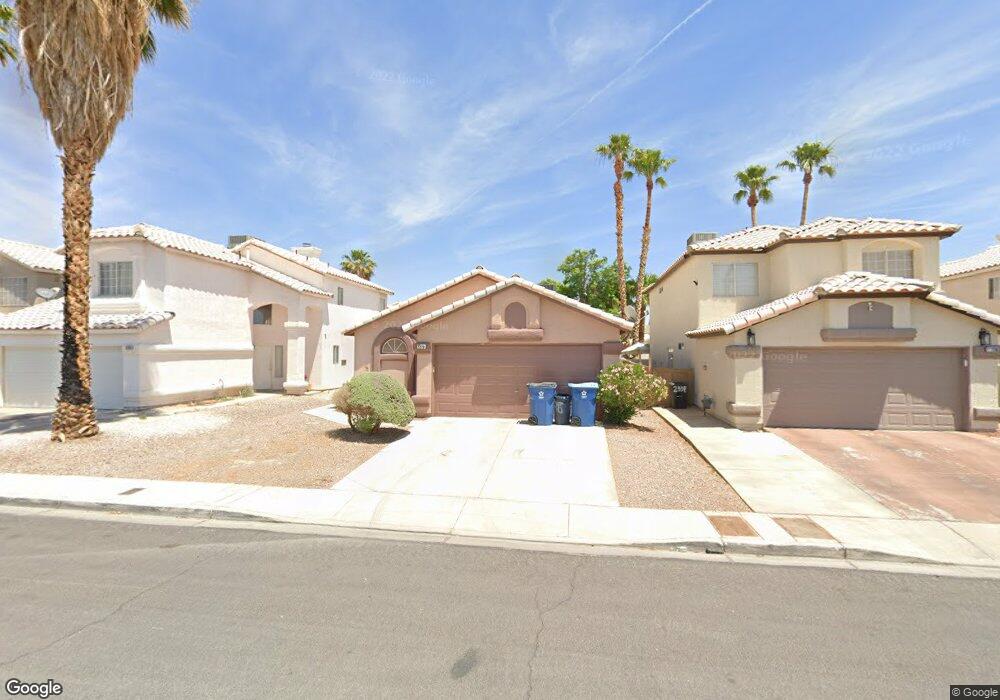
2328 Tuscarora Ct Las Vegas, NV 89142
Estimated Value: $339,248 - $363,000
3
Beds
2
Baths
1,227
Sq Ft
$287/Sq Ft
Est. Value
About This Home
This home is located at 2328 Tuscarora Ct, Las Vegas, NV 89142 and is currently estimated at $351,562, approximately $286 per square foot. 2328 Tuscarora Ct is a home located in Clark County with nearby schools including John F. Mendoza Elementary School, Duane D. Keller Middle School, and Las Vegas High School.
Ownership History
Date
Name
Owned For
Owner Type
Purchase Details
Closed on
Jun 12, 2024
Sold by
Ross Sue E
Bought by
Sue E Ross Living Trust and Ross
Current Estimated Value
Purchase Details
Closed on
Sep 26, 2006
Sold by
Ross Sue E
Bought by
Ross Sue E
Home Financials for this Owner
Home Financials are based on the most recent Mortgage that was taken out on this home.
Original Mortgage
$200,250
Interest Rate
7%
Mortgage Type
Balloon
Purchase Details
Closed on
Apr 21, 2005
Sold by
Ross Marilyn S
Bought by
Ross Sue E
Home Financials for this Owner
Home Financials are based on the most recent Mortgage that was taken out on this home.
Original Mortgage
$128,000
Interest Rate
10.45%
Mortgage Type
New Conventional
Purchase Details
Closed on
Sep 22, 2004
Sold by
2328 Tuscarora Trust Equiventure Llc
Bought by
Ross Sue E
Purchase Details
Closed on
Oct 16, 2002
Sold by
Ross Marilyn S
Bought by
Ross Sue E
Purchase Details
Closed on
Mar 28, 1995
Sold by
Pacific Homes
Bought by
Ross Sue E and Ross Marilyn S
Home Financials for this Owner
Home Financials are based on the most recent Mortgage that was taken out on this home.
Original Mortgage
$98,364
Interest Rate
8.9%
Mortgage Type
FHA
Create a Home Valuation Report for This Property
The Home Valuation Report is an in-depth analysis detailing your home's value as well as a comparison with similar homes in the area
Home Values in the Area
Average Home Value in this Area
Purchase History
| Date | Buyer | Sale Price | Title Company |
|---|---|---|---|
| Sue E Ross Living Trust | -- | None Listed On Document | |
| Ross Sue E | -- | National Alliance Title | |
| Ross Sue E | -- | Southwest Title | |
| Ross Sue E | -- | -- | |
| Ross Sue E | $98,000 | Stewart Title | |
| Ross Sue E | $99,000 | Nevada Title Company |
Source: Public Records
Mortgage History
| Date | Status | Borrower | Loan Amount |
|---|---|---|---|
| Previous Owner | Ross Sue E | $200,250 | |
| Previous Owner | Ross Sue E | $128,000 | |
| Previous Owner | Ross Sue E | $98,364 |
Source: Public Records
Tax History Compared to Growth
Tax History
| Year | Tax Paid | Tax Assessment Tax Assessment Total Assessment is a certain percentage of the fair market value that is determined by local assessors to be the total taxable value of land and additions on the property. | Land | Improvement |
|---|---|---|---|---|
| 2025 | $954 | $68,215 | $22,750 | $45,465 |
| 2024 | $927 | $68,215 | $22,750 | $45,465 |
| 2023 | $1,008 | $69,584 | $26,250 | $43,334 |
| 2022 | $900 | $61,440 | $21,700 | $39,740 |
| 2021 | $874 | $57,832 | $19,950 | $37,882 |
| 2020 | $845 | $56,610 | $18,900 | $37,710 |
| 2019 | $821 | $53,341 | $16,100 | $37,241 |
| 2018 | $797 | $49,291 | $13,300 | $35,991 |
| 2017 | $1,361 | $46,390 | $9,800 | $36,590 |
| 2016 | $1,008 | $41,484 | $8,400 | $33,084 |
| 2015 | $1,005 | $30,332 | $5,600 | $24,732 |
| 2014 | $983 | $24,728 | $5,250 | $19,478 |
Source: Public Records
Map
Nearby Homes
- 2307 Tuscarora Ct
- 6028 Las Nubes Dr
- 2179 Raspberry Hill Rd
- 5650 E Sahara Ave Unit 2010
- 5650 E Sahara Ave Unit 2007
- 5650 E Sahara Ave Unit 1035
- 5857 Rainbow Bridge Dr
- 1950 Turtlerock St
- 6080 Saint Petersburg Dr
- 2229 Bowstring Dr
- 5816 Glory Canyon Way
- 5655 E Sahara Ave Unit 2048
- 5655 E Sahara Ave Unit 2009
- 5655 E Sahara Ave Unit 1003
- 5655 E Sahara Ave Unit 2068
- 5655 E Sahara Ave Unit 2020
- 5926 Mahogany Mountain Dr
- 6131 Pumpkin Patch Ave
- 5714 Roundrock Dr
- 1927 Raspberry Hill Rd
- 2318 Tuscarora Ct
- 2338 Tuscarora Ct
- 2308 Tuscarora Ct
- 2348 Tuscarora Ct
- 2329 Minden Way
- 2339 Minden Way
- 2298 Tuscarora Ct
- 2358 Tuscarora Ct
- 2349 Minden Way
- 2309 Minden Way
- 2327 Tuscarora Ct
- 2337 Tuscarora Ct
- 2317 Tuscarora Ct
- 2299 Minden Way
- 2359 Minden Way
- 2288 Tuscarora Ct
- 2347 Tuscarora Ct
- 2297 Tuscarora Ct
- 2357 Tuscarora Ct